
Social security and household incomes in Australia
We can measure reliance on or use of social security using ABS statistics on income distribution. These show the proportion of households for whom social security cash benefits are the main source of income, that is, where social security payments are the largest single source of income usually 50% or more. Figure 1 shows these trends in Australia from 1994-95 to 2013-14.
Figure 1: Reliance on social security has been falling
% of households by age with social security as main source of income
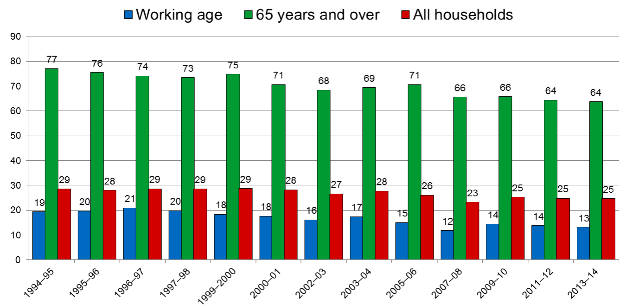
Source: ABS, Household Income and Wealth, Cat. No. 6523.0, various years.
The numbers in Figure 1 refer to the proportion of households for whom social security payments (including Family Tax Benefits and other supplementary payments) constitute the largest single share of their annual income. This differs from the presentation of recipient numbers for social security in Figure 2 of Part 2 which refer to the proportion of individuals receiving any income from income support payments only at a point in time each year. While these differences in definition explain the differences in these numbers, the two series are generally quite consistent.
For example, an Age Pensioner couple will count as one household but two individuals. If the couple derive more than half of their income from investments they will not be counted as a recipient household, but they will still be counted administratively as individual recipients.
The proportion of households with a reference person aged 65 years and over for whom social security is the main income source has fallen from 77% to 64% over the two decades to 2014. The proportion of households with a working age head in the same situation has fallen by more than one-third, from 19% to 13%. The share of all households for whom social security is the main source of income has fallen less rapidly than either age group from 29% to 25%, because the reduction in age-specific rates of receipt has been partly offset by the ageing of the population.
Figure 2 provides a more detailed disaggregation of reliance on social security payments by age of household head among the population of working age between 1996-97 and 2013-14. The most notable feature is that the decline in reliance on social security benefits has been greatest among households with a reference person aged 55 to 64 years, the pre-retirement age group. Reliance on social security has decreased least – by around one-fifth – among households with a reference person aged 15-24 years (but a minority of persons in this age group are heads of households). Among other working-age households, the share reliant on social security benefits has fallen by between one-third and two fifths.
For those in the pre-retirement age group, reliance on social security has more than halved; this is likely to reflect the policy reforms discussed earlier – the raising of the age pension age for women, and the phasing-out of the dependency related payments.
Figure 2: % of working-age households by age with social security as main source of income, 1996-97 to 2013-14
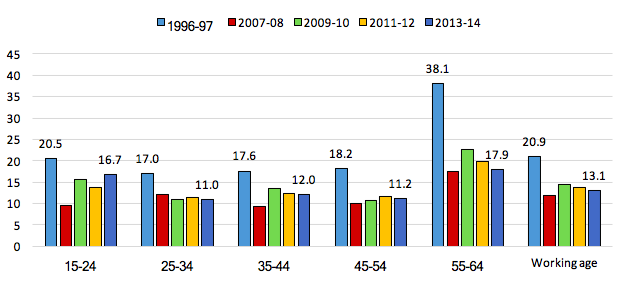
Source: ABS, Household Income and Wealth, Cat. No. 6523.0, various years.
Table 1 further breaks down receipt of social security for the population of Australian households over the period from 1994-95 to 2013-14 by the degree of reliance on social security payments. The previous discussion concentrated on those for whom social security was the main source of income, which is broadly equivalent to the sum of the last two columns in Table 1 (between 50 and 90% of income from social security, and 90% or more).
Table 1: Contribution of government pensions and allowances to gross household income
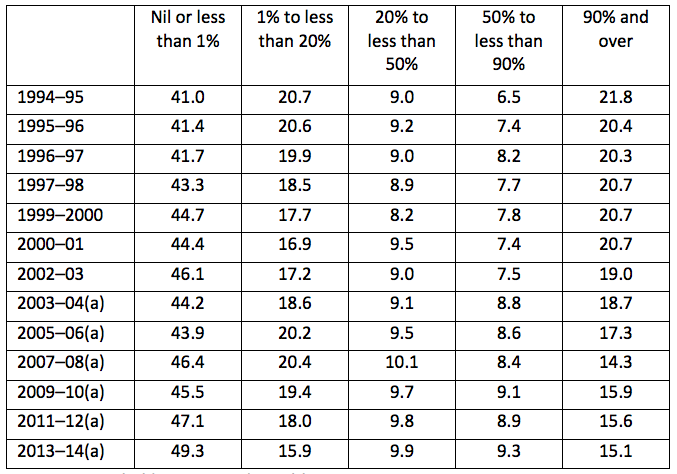
Source: Source: ABS, Household Income and Wealth, Cat. No. 6523.0, various years.
Table 1 shows that over this time period the proportion of household completely independent of social security increased from 41% to more than 49% of all Australian households. At the other end of the spectrum, where households received 90% or more of their income from cash benefits, heavy reliance has fallen from close to 22% to 15% of households.
This article is based on Whiteford, P (2017): Social security and welfare spending in Australia: assessing long-term trends, TTPI Policy Brief 1/2017. Read Part 1, Part 2, Part 4 and Part 5.
References
Australian Bureau of Statistics (various years), Household Income and Wealth, Cat. No. 6523.0, Canberra.


Recent Comments