

For some time, the largest single component of Commonwealth Government spending in Australia has been “Social Security and Welfare”, estimated at 35.3 per cent of total expenses in 2017-18 (shown in Figure 1).
Figure 1: Components of Commonwealth Government Spending, 2107-18, % of total
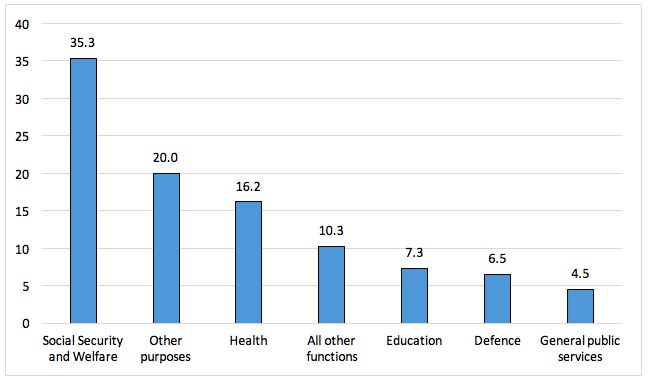
Source: Department of the Treasury, 2017-18 Budget, Budget Paper No.1, Statement 6, Chart 1.
Given that it is the largest component of Commonwealth Government spending, it is not surprising that “Social Security and Welfare” has been a prominent target for expenditure cuts. Apart from the size of spending, the rationale put forward by successive Ministers is that this area of spending has grown and will grow at an unsustainable rate.
Commentators outside of government have also pointed to costs of social security and welfare as putting pressure on future government budgets. For example the Shepherd Review commissioned by the Menzies Research Centre argues that “significant spending on non-revenue generating payments (such as social security welfare, defence and health) is forecast to grow faster than GDP” pointing to the ageing of the population (pages 8-9), the complexity surrounding income support and incentives to work, and “the ever growing rise in eligibility for entitlement” (page 17).
This series of blog posts provide a summary and analysis of the current structure of the main social security and welfare spending programmes in Australia, as well as trends in spending and recipient numbers. They also look at indicators of how the Australian system compares with those in other high income countries belonging to the OECD.
This Part 1 examines trends in spending over the longer run from 1980 up to 2014 is analysed using OECD data as they are the most accessible long-run statistical series on social spending in Australia and other high income countries. Improvements in the comprehensiveness of OECD data also affect recorded levels of spending over time and the post compares estimates of spending that adjust for these data improvements.
Part 2 provides an analysis of trends in the number of people and households in Australia receiving social security benefits over the past 20 years, based on administrative data published by the Department of Social Services as well as survey data from the Australian Bureau of Statistics on the incomes of Australian households.
Part 3 will provide a wide range of information about how spending on social security and welfare – or spending on cash benefits and “non-cash” services – compares between OECD countries. Part 4 shows how Australia differs from other high income countries and the distribution of welfare spending across different income groups and its implications for proposals for spending cuts.
Part 5 concludes with a discussion of the implications of social security trends and changes for future Budget and social policy initiatives.
How much is spent?
The Australian income support system consists of a range of different pensions and benefits designed to provide a minimum level of income support, each with its own eligibility criteria and, where applicable “looking for work or other activity” requirements. People must fall into specified categories to be eligible for assistance. At a point in time, people are only entitled to one income support payment, but over the course of a year or longer it is possible to be entitled to differing payments.
There are two main payments for people of retirement age – the age pension and the service pension for people who have qualifying war service. There are around 14 different categories of payment for people of working age: e.g. people with a disability, their carers, primary carers of dependent children, the unemployed and full-time students.
There is an extensive system of additional payments for children, which is also income-tested. The same system covers children in families in work as those in families that are unemployed or outside the workforce, with higher rates of payment for lower income families. There is also a wide range of supplementary payments to assist in covering additional costs such as housing costs, expenses associated with living in remote areas, and telephone and pharmaceutical costs for example.
Figure 2 shows trends in spending on social security cash benefits and welfare services in Australia from 1980 up until 2014. The data underlying this figure are given in Table A at the end of this post. The data come from the OECD Social Expenditure database, which provides the longest time series of readily available data on social spending. It should be noted, however, that this encompasses more than Federal Government spending on social security, and includes State government spending, notably on workers’ compensation (from 1990 onwards) as well as spending by State governments on age and disability services. Spending on pre-schools (close to $11 billion in 2014) is also included in the OECD data on spending on family services, but is not included in “Social Security and Welfare” (SSW) in the Commonwealth Budget papers. Similarly, spending on active labour market programmes (ALMPs) and related employment services are included in the OECD figures, but not under SSW. As a result, the levels of spending in OECD figures will be higher than spending as measured in Commonwealth Government Budget papers.[1]
Figure 2: Trends in spending on social security cash benefits and welfare services, Australia, 1980 to 2014 (% of GDP)
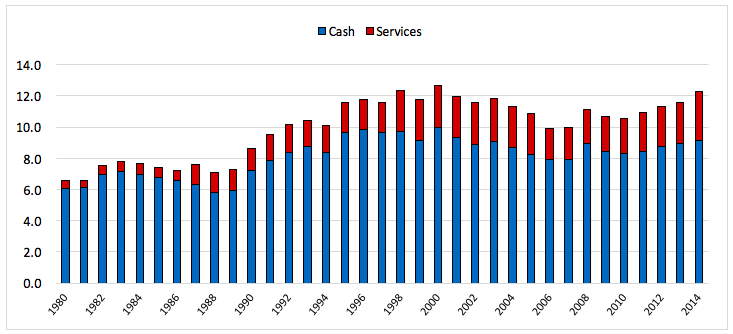
Source: OECD Social Expenditure database, Data extracted on 30 Apr 2017 from OECD.Stat, http://stats.oecd.org/Index.aspx?DataSetCode=SOCX_DET#
Figure 2 shows spending on cash benefits increased from 6.1% of GDP to peak at 10.0% of GDP in 2000 (as a result of the increased spending on the “compensation package” accompanying the introduction of the Goods and Services Tax (GST)); spending then declined to 7.9% of GDP in 2007, jumped to 9.0% in 2008 as a result of the stimulus package at the time of the Global Financial Crisis (GFC); it then fell up to 2010 before rising to 9.2% of GDP in 2014.
Spending on welfare services was well under 1% of GDP up until 1986, but then apparently increased significantly – partly as a result of more comprehensive reporting of data. Spending on welfare services has exceeded 2% of GDP since 1998 and reached 3.1% of GDP in 2014.
Figure 3 shows trends in spending on cash benefits by programme area over the same time frame. Spending on cash benefits for older people – the largest component of spending on cash benefits – rose from 3.0 to 4.1% of GDP over this long period. A significant part of this increase is explained by the inclusion of spending on public service pensions and lump sums from 1995, estimated to total $22.7 billion in 2014. Excluding this area of spending – which is not included in Social Security and Welfare in the Commonwealth Budget – means that spending on all other cash benefits for older people fell from 3.0% to 2.8% of GDP over this period, with a very slight fall in spending on age pensions and a more substantial decline in spending on service pensions.
Spending on incapacity cash benefits rose from 0.9% of GDP in 1980 to 2.1% in 2014. Again. However, this is affected by improvements in the comprehensiveness of OECD data, with the inclusion of workers’ compensation spending from 1990 onwards, much of which is at the State government level and is estimated to be $8.5 billion in 2014. Excluding workers’ compensation, spending on incapacity cash benefits rose from 0.9% to 1.6% of GDP over this period. A range of factors influencing these trends is discussed later in this paper.
Figure 3: Trends in spending on social security cash benefits by program area, Australia, 1980 to 2014 (% of GDP)
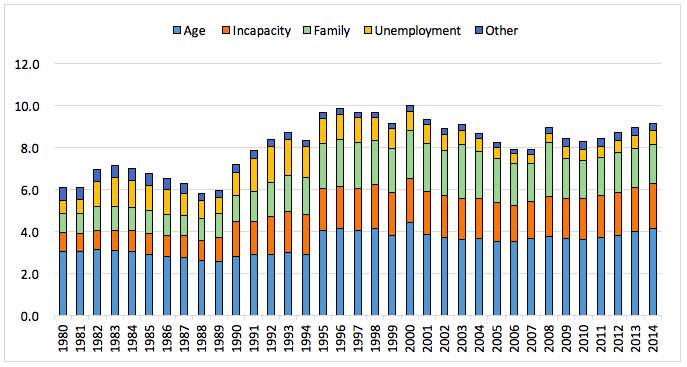
Source: OECD Social Expenditure database, Data extracted on 30 Apr 2017 from OECD.Stat, http://stats.oecd.org/Index.aspx?DataSetCode=SOCX_DET#
Spending on family cash benefits – mainly what is now Family Tax Benefit Part A, but also including parenting payments for lone parents and couples and Parental Leave Pay – increased from 0.9 % of GDP to a peak of 2.6% of GDP in 2003, and has subsequently declined to 1.9% of GDP in 2014, although with a temporary spike back to 2.6% of GDP in 2008, as a result of stimulus payments at the time of the GFC. Most of the increase in spending on family cash benefits occurred in the period of the Hawke-Keating governments with spending increasing from 1.1% of GDP in 1983 to 2.2% in 1996. This was a result of the increased generosity of payments for children as part of the Hawke government’s anti-child poverty policies, and the growth in the share of jobless families following the recession of the early 1980s and again in the early 1990s. There were further increases under the Howard Government up until 2003, with falls thereafter – reflecting the rapid growth in GDP at this time – followed by further falls after 2009, due to policy changes.
Spending on the unemployed has varied significantly over time, largely reflecting broader labour market trends. Spending doubled from around 0.7% of GDP to 1.4% between 1980 and 1983 as a result of the recession in this period. It then fell back to 0.8% of GDP in 1989 as a result of economic recovery, but more than doubled to 1.7% of GDP by 1993, when unemployment reached 10.8 %. The sustained recovery – and the fact that payment rates are only indexed to the CPI – saw spending fall to 0.4% of GDP by 2007. Following the GFC, spending went back up to 0.7% of GDP by 2014, but this increase also reflected policy changes to eligibility for Parenting Payment Single and the Disability Support Pension, discussed below.
The final category is other spending, which has fallen from around 0.6% of GDP in the early 1980s to below 0.4% of GDP in recent years. Virtually all of this spending in 2014 was on income support for students – Youth Allowance (Students), AUSTUDY and ABSTUDY.
In order to show the effects of the improvements in OECD data over the period since 1980, Figure 4 compares the original OECD data in the Aggregate Social Expenditure database with figures calculated by deducting the major areas of cash benefits that are not included in the Commonwealth Budget Papers’ definition of spending on Social Security and Welfare – that is spending on public service pensions and lump sums in spending on the aged, and spending on workers’ compensation payments in spending on incapacity benefits. (The dollar figures for these are available at the programme level in the OECD Detailed Social Expenditure database.)
Figure 4: Comparison of OECD data on spending on Age and Incapacity and adjusted spending, Australia, 1980 to 2014
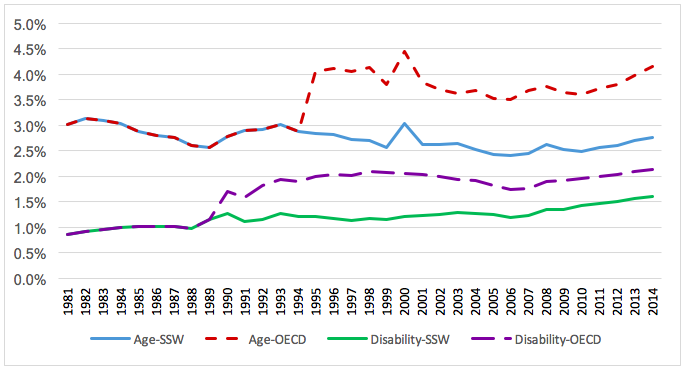
Note: OECD series are those given in the OECD Social Expenditure Database; SSW figures for Age are total OECD spending minus spending on public service pensions and lump sums; SSW figures for Disability are total OECD spending on incapacity cash benefits minus spending on workers compensation. Source: OECD Social Expenditure database, Data extracted on 9 May 2017 from OECD.Stat, http://stats.oecd.org/Index.aspx?DataSetCode=SOCX_DET#
The figure shows the break in each series associated with the data improvements made to the OECD database by the inclusion of workers’ compensation from 1990 and public sector superannuation from 1995, with the latter having the most significant effect – boosting recorded spending from 2.8% to 4.1% of GDP. This difference has remained broadly stable over time, but has increased in relative terms since 2010. The gap in spending on incapacity cash benefits associated with the inclusion of workers’ compensation peaked in the late 1990s and has reduced over time since then.
[1] In addition, there are some inconsistencies in OECD spending figures over time, due to additions and improvements, for example, the inclusion of data on spending on State workers’ compensation schemes from 1990.
This article is based on Whiteford, P (2017): Social security and welfare spending in Australia: assessing long-term trends, TTPI Policy Brief 1/2017. Full details on spending on cash benefits by social policy area are shown in the full Policy Brief. Read Part 2, Part 3, Part 4 and Part 5.
References
Department of the Treasury, 2017-18 Budget, Budget Paper No.1, Statement 6, Canberra.
Ireland, J. (2015), “Carer, disability and family payments in sights of new Social Services Minister Christian Porter”, October 14 2015, http://www.smh.com.au/federal-politics/political-news/carer-disability-and-family-payments-in-sights-of-new-social-services-minister-christian-porter-20151014-gk8lq5.html
Jabour, B. (2014), “Australia’s ‘unsustainable’ welfare system to be overhauled, says minister”, The Guardian, 21 January 2014, https://www.theguardian.com/world/2014/jan/21/australias-unsustainable-welfare-system-to-be-overhauled-says-minister
Meers, D. (2015), “Australia’s welfare bill to top $190b with taxpayers funding 240 million payments a year”, June 29 2015, http://www.dailytelegraph.com.au/news/nsw/australias-welfare-bill-to-top-190b-with-taxpayers-funding-240-million-payments-a-year/news-story/0e6be93c70fe359caa2b8e7ed4ae8312
OECD (2017), OECD Social Expenditure database, Data extracted on 30 Apr 2017 from OECD.Stat, http://stats.oecd.org/Index.aspx?DataSetCode=SOCX_DET# Paris.


Recent Comments