

This post was originally published as part of the Tax and Transfer Policy Institute Policy Brief series. Read Part 2 here.
The Open Budget Survey 2017, released in January 2018, assesses and compares budget transparency, oversight and participation in countries around the globe. Countries are ranked in the Open Budget Index (OBI) using their transparency score from the Survey. We previously provided a brief overview of the Survey including Australian findings and recommendations. This Policy Brief explains the OBI in more detail and discusses the state of budget transparency, participation and oversight in Australia, regionally and globally. We identify some gaps in the Australian budget system and conclude with lessons to be learned from the Survey for Australia and the region.
The Open Budget Survey is the only independent global survey on budget transparency. It is conducted every two years by a US-based non-government organisation, the International Budget Partnership (IBP). This is the sixth Survey coordinated by the IBP, but it is the first time Australia has been included. In its first Survey report, Australia received a transparency score of 74 out of 100 and was ranked 12 out of 115 countries in the OBI. The three highest-ranked countries are New Zealand (score: 89), South Africa (score: 89) and Sweden (score: 87).
The IBP works with independent researchers within countries to make evidence-based assessments about the country’s budget system. The Australian questionnaire was completed by the Tax and Transfer Policy Institute (TTPI). The assessments are subject to rigorous and anonymous review by governments and independent reviewers. The questionnaire, country report and correspondence in the review process can be viewed on the IBP website.
Australia’s score of 74 out of 100 indicates that Australia has a good level of transparency and provides substantial budget information to its citizens. Australia also does well on budget oversight scoring 70 out of 100, indicating that it has adequate institutional practices in place to oversee the budget process.
On the third measure of public participation, Australia received a lower score of 41 out of 100. The Survey finds that participation opportunities are scarce in most participating countries so, with this low score, Australia is in fact close to the top. New Zealand has the highest participation score globally, at 59 out of 100.
Budget transparency and accountability: A global challenge
If there is one thing to be learned from this year’s Open Budget Survey report, it is not to take budget transparency and accountability for granted. This year’s report depicts a rather bleak global picture for budget transparency.
In this round, the Survey assessed 115 countries, 13 more than the previous 2015 edition. The Survey finds that only 26 of the 115 countries surveyed have adequate budget transparency (defined as countries with a score of 61 and above). The Survey covers developed and developing countries across most continents. There are 22 OECD countries in the Survey this year including Australia, Canada and Japan as new additions. Australia’s score of 74 puts it equal with France and the United Kingdom.
For the first time since the Survey began in 2006, global progress toward greater transparency has stalled. The average OBI score fell two points to 43 in 2017 for the 102 countries surveyed in both rounds.[1] There are regional differences. Asia Pacific and South Asia have recorded significant improvements in their transparency scores, but other regions saw slower growth or declines. In particular, Sub-Saharan African countries recorded a double-digit fall in transparency: the regional average score of Sub-Saharan Africa declined from 39 in 2015 to 29 in 2017.
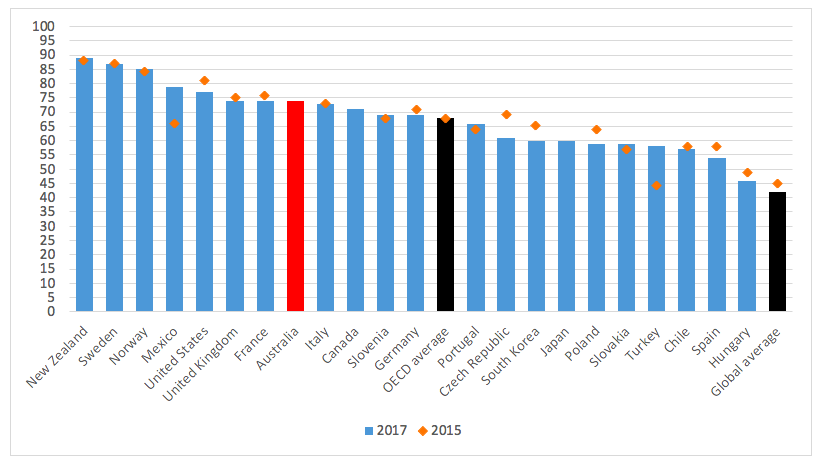
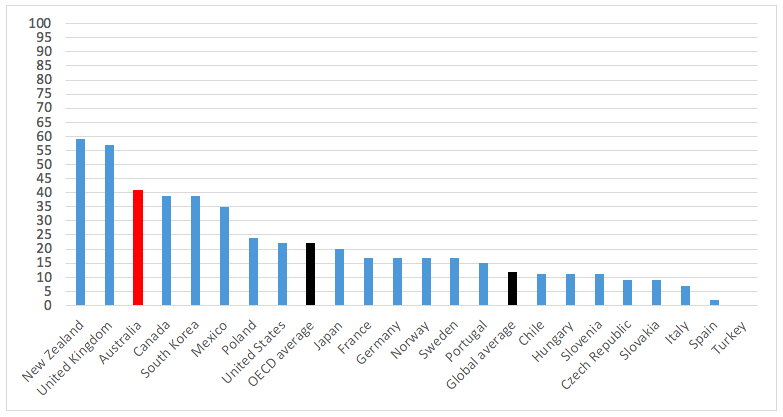
Even developed countries are facing challenges in maintaining and enhancing budget transparency, with some countries registering a decline in their score, notwithstanding the fact that they are still more transparent than most parts of the world. All OECD countries perform better than the global average of 42. However, eight are deemed not to be providing sufficient information to the public. Hungary is the lowest, with a score of 46. This year’s scores of OECD member countries are presented in Figure 1.
Figure 1: Open Budget Index – OECD countries and global average
 Source: IBP 2015; 2018a
Note: Scores of 81-100 indicate provision of extensive budget information, 61-80 indicate substantial budget information, 41-60 indicate limited budget information, 21-40 indicate minimal budget information and 0-20 indicate scant budget information. Australia, Canada and Japan are new additions in this round.
The United States transparency score fell four points from 81 in 2015 to 77 in 2017; Spain’s score slipped four points to 54; Germany’s score declined two points to 64; France’s score fell two points to 74 and the UK’s score dropped one point to 74. These declines in transparency scores of developed countries have occurred at a time when there appears to be declining public trust in the government and in democracy in these countries, and voters may feel that the systems are distorted to serve the rich and powerful rather than the masses (Edelman 2017).
The global assessments are also not optimistic about the other pillars of budget accountability, being oversight and participation. Most countries have weak legislative oversight of their budgets, with only 28% of legislatures having adequate practices in place to oversee the budget process.
Better scores are achieved for oversight by supreme audit institutions, such as the Australian National Audit Office (two-thirds of the countries had adequate oversight). However, audit institutions tend to be weaker in countries with less transparency. The Survey also identifies independent fiscal institutions for the first time, finding that 18 countries surveyed have such an institution – including Australia’s Parliamentary Budget Office.
The Survey finds not a single country has adequate participation opportunities in place for the public. Four countries (New Zealand, the UK, Australia and the Philippines) are in the range of 41 to 60, which indicates limited opportunities for public participation. The remaining 111 countries scored less than 40.
Improvements in the Asia Pacific
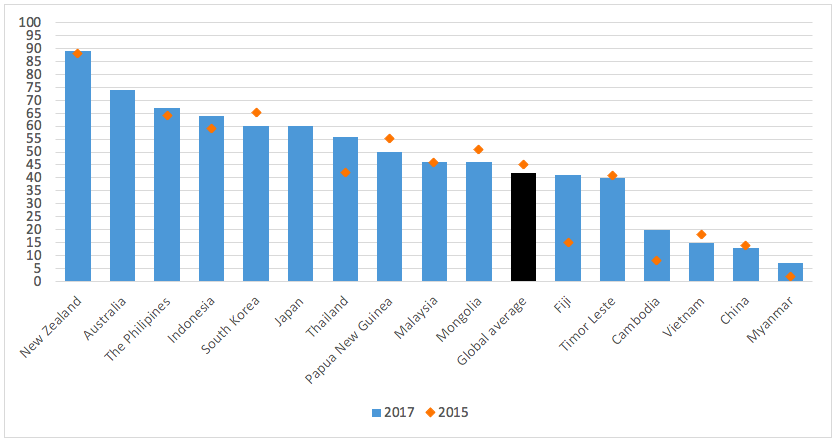
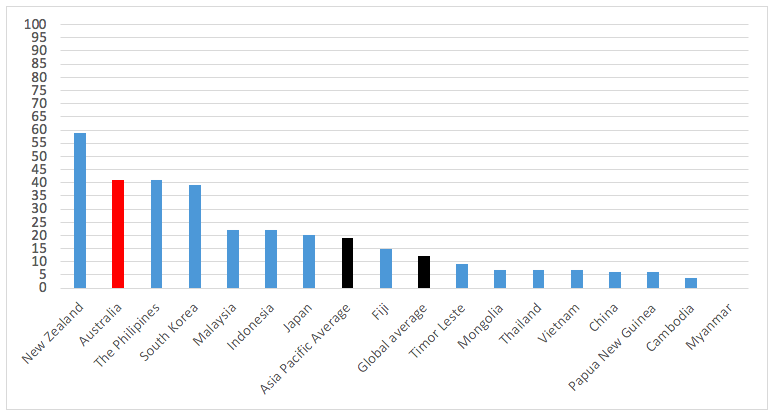
There are still some reasons to be optimistic. Overall, government budgets are generally more transparent today than they were a decade ago. In the Asia Pacific, we see progress toward greater transparency, albeit from a lower basis. Figure 2 shows the 16 Asia Pacific countries covered in the Survey and their score compared to the global average.
Figure 2: Open Budget Index – Asia Pacific countries and global average
 Source: IBP 2015; 2018a
Note: Scores of 81-100 indicate provision of extensive budget information, 61-80 indicate substantial budget information, 41-60 indicate limited budget information, 21-40 indicate minimal budget information and 0-20 indicate scant budget information. Australia and Japan are new additions.
Some of the spectacular improvers in this year’s Survey are from our part of the world, including Fiji (improved 26 points to 41), Thailand (improved 14 points to 56), Cambodia (improved 12 points to 20) and Myanmar (improved 5 points to 7). This pushed up the regional average transparency score by 3 points to 44.
However, promoting budget transparency is still a challenge in China, with its transparency score dropped one point to 13 in this round. Its neighbour South Korea also slipped 5 points to 60. New Zealand is far ahead of other countries in the region with a score of 89, slightly improved from 88 in 2015. Malaysia remains unchanged at a score of 46.
How Australia performs
From a global perspective, Australia performs relatively well. This is not surprising, given that Australia has a vibrant parliamentary democracy, an effective annual budget process and was able to implement a number of reforms since the 1990s to enhance budget transparency including the Charter of Budget Honesty (1998), which uses the disclosure of budget information as a means to achieve fiscal discipline of the Government. However, there are also some gaps in the Australian budget system, as identified by the Survey country report.
This Survey assessed budget events and activities that occurred in the period up to 31 December 2016. Thus, for Australia, the Survey covers the whole of the 2015-16 budget year and the first half of the 2016-17 budget year.
Budget Transparency
Australia’s score of 74 is considerably higher than the global average of 42 and indicates that relevant budget information is provided to the public to a large extent.
In the Asia Pacific region, Australia is only behind New Zealand and has a higher score than the two other developed countries participating in the Survey, South Korea and Japan, which share an equal rank of 27 globally (see Figure 2). The Philippines (score: 64), another budget transparency enthusiast in the region, ranks 19th globally and 3rd in the region. Even within the OECD, a natural comparison for Australia, the country is in the leading group. Out of 35 OECD countries, 22 participated in the Survey. Australia’s score of 74 is higher than the OECD average of 68 and also better than another new entrant, Canada (see Figure 1). Yet, Australia still lags behind the United States and New Zealand.
The Survey report presents more detailed transparency scores for eight key budget documents, which according to the best practices, should be made available on a timely basis to the public at different stages throughout the budget process.[2] Australia performs well in publishing most budget documents, which include:
- Executive’s Budget Proposal (score: 87 out of 100);
- In-Year Reports: Commonwealth Monthly Financial Statements (score: 70);
- Mid-Year Review: Mid-Year Economic and Fiscal Outlook (MYEFO) report (score: 93);
- Year-End Report: Budget Outcome Report (score: 64); and
- Audit Report by the Australian National Audit Office (score: 81).
However, Australia performs less well for other key documents. In particular, Australia does not publish a Pre-Budget Statement (score: 0, as pre-budget documents are produced only for internal use of the government). Australia also publishes less information than the benchmark in the Enacted Budget (the Appropriation Acts, score: 39) and the Citizens Budget (a simpler and less technical version of the government’s budget documentation, which is available at the Treasury’s Budget website, score: 50).
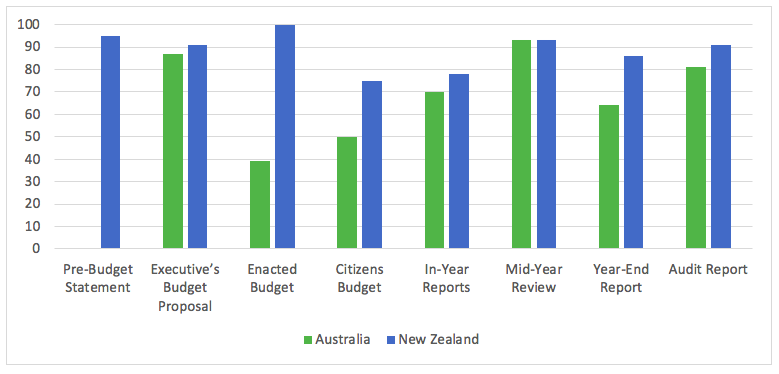
To put the findings into perspective, we can compare Australia with our trans-Tasman neighbour New Zealand, since both countries share similar political, institutional and historical roots. New Zealand is far ahead of Australia in terms of budget transparency in respect of all budget documents except the Mid-Year Review where both countries scored the same (see Figure 3).
Figure 3: How comprehensive is the information provided in the key budget documents? Comparison between Australia and New Zealand
 Source: IBP 2018b, 2018d
Note: Scores of 81-100 indicate provision of extensive budget information, 61-80 indicate substantial budget information, 41-60 indicate limited budget information, 21-40 indicate minimal budget information and 0-20 indicate scant budget information.
Out of the eight budget documents, New Zealand has six providing extensive information (scores 81-100), while the remaining have substantial information (scores 61-80). Whereas Australia only has three providing extensive information and two providing substantial information. This suggests there are significant gaps between the two countries in budget transparency.
Budget oversight
Australia scored 70 out of 100 for institutional oversight of the budget, suggesting there are adequate practices in place to oversee the budget.
Figure 4 compares Australia’s budget oversight score with other OECD countries participating in the Survey. Australia’s score is slightly above the OECD average of 69 and far behind Norway (score: 91), which tops among the OECD countries. Australia lags behind Germany (score: 89), France (score: 85), South Korea (score: 85), the United States (score: 85) and New Zealand (score: 78), but is still ahead of the UK (score: 63). There are six OECD countries that do not have adequate institutional oversight, including Japan and Canada.
Figure 4: Budget oversight – comparison with OECD countries
 Source: IBP 2018a; OECD average is based on our own calculation.
Note: Scores of 61-100 indicate adequate oversight, 41-60 indicate limited oversight and 0-40 indicate weak oversight.
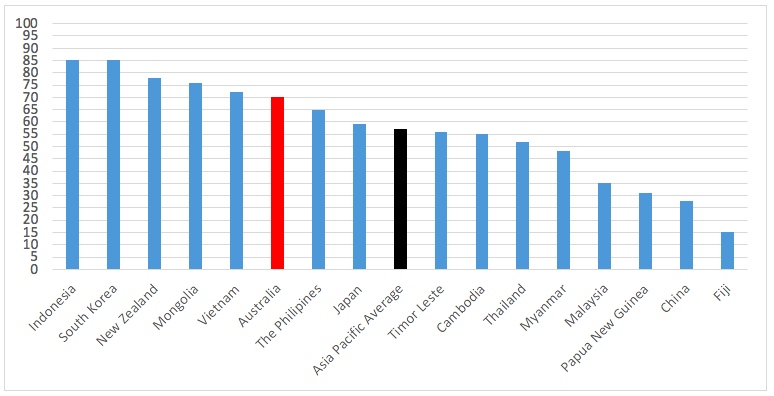
In the Asia Pacific region, Australia lags behind Indonesia (score: 85), South Korea (score: 85), New Zealand (score: 78), Mongolia (score: 76) and, surprisingly, Vietnam (score: 72), which has a transparency score of 15. This suggests that adequate oversight practices do not necessarily lead to accountable budgets if transparency is absent. Fiji has the weakest institutional oversight in the region, with a score of 15; while China (score: 28) is only slightly better. Figure 5 provides a comparison of Asia Pacific countries.
Figure 5: Budget oversight – comparison with Asia Pacific countries
 Source: IBP 2018a; OECD average is based on our own calculation.
Note: Scores of 61-100 indicate adequate oversight, 41-60 indicate limited oversight and 0-40 indicate weak oversight.
Australia’s financial oversight by the Australian National Audit Office (ANAO) is very strong (score: 100). The main reason Australia is trailing behind other is because of its relatively weak legislative budget oversight. The Survey finds that the Parliament provides adequate oversight at the executive and audit stage (score: 67), but limited oversight at the formulation and approval stage for the budget (score: 48).
The main barriers to effective legislative oversight in Australia, according to the country report, are the lack of pre-budget debate by the Parliament, the Executive’s Budget Proposal being only available to members of Parliament less than two months before the start of the budget year, and in-year budget implementation not examined by a parliamentary committee.
Public participation
Public participation is the weakest link in Australia’s budget accountability system. Australia scored only 41 out of 100, indicating limited opportunities for the public to engage in the budget process. Yet, participation opportunities are much scarcer in most other countries in the world and Australia is in fact one of the top performers on participation. Even among OECD countries, less than half scored more than 20 and Turkey scored nil. Figure 6 provides a comparison of the public participation opportunities available in OECD countries.
Figure 6: Public participation – comparison with OECD countries and global average
 Source: IBP 2018a; the OECD average is based on our own calculation.
Note: Scores of 61-100 indicate adequate public participation opportunities, 41-60 indicate limited opportunities and 0-40 indicate few or no opportunities.
Interestingly, three out of the four top performers on participation are in the Asia Pacific region (see Figure 7). South Korea is not far behind Australia with a score of 39. However, half of the countries in the Asia Pacific have participation scores below the global average of 12.
Figure 7: Public participation – comparison with Asia Pacific countries and global average
 Source: IBP 2018a; the Asia Pacific average is based on our own calculation.
Note: Scores of 61-100 indicate adequate public participation opportunities, 41-60 indicate limited opportunities and 0-40 indicate few or no opportunities.
The Australian participation score is particularly low for the executive branch (score: 30), which reflects the lack of opportunities for the public to participate when the budget is formulated. Opportunities are more, but still limited, for the public to participate in the legislative branch (score: 50). The ANAO, with a score of 67, is the only institution in Australia found to provide adequate opportunities for the public to engage.
[1] The decline is partly due to the change in definition of ‘publicly available’ this round to exclude hard copies document and consider only those available on the internet. This requirement should not be the cause of declines in developed countries. The IBP identifies a decline in globally transparency even if the definition is unchanged, mainly due to deteriorating transparency in Sub-Saharan Africa.
[2] See the OBS 2017 report (IBP 2018a), p.49 for the release deadlines of the documents.
Further readings
Alt, JE & Lassen, DD 2006, ‘Transparency, political polarization, and political budget cycle in OECD countries’, American Journal of Political Science, vol. 50, no. 3, pp. 530-550;
Alt, JE, Lassen, DD & Wehner, J 2012, Moral hazard in an economic union: politics, economics, and fiscal gimmickry in Europe, available at SSRN, https://ssrn.com/abstract=2102334
Arbatli, E & Escolano, J 2015, ‘Fiscal transparency, fiscal performance and credit ratings’, Fiscal Studies, vol. 36, no. 2, pp. 237-270
Arbatli, E & Mastruzzi, M 2016, How does civil society use budget information?, International Budget Partnership, Washington DC.
de Renzio, P & Masud, H 2011, ‘Measuring and promoting budget transparency: the Open Budget Index as a research and advocacy tool’, Governance, vol. 24, no. 3, pp. 607-616.
Edelman 2017, Edelman trust barometer 2017: Executive summary, http://fipp.s3.amazonaws.com/media/documents/Edelman%20Trust%20Barometer%202017_Executive%20Summary.pdf.
Global Initiative for Fiscal Transparency 2015, Principles of Public Participation in Fiscal Policy, http://fiscaltransparency.net/PP_Approved_in_General_13Dec15.pdf.
Hawke, L & Wanna, J 2010, ‘Australia after budgetary reform: a lapsed pioneer or decorative architect?’, in J Wanna, L Jensen & J d Vries (eds), The reality of budgetary reforms in OECD nations: trajectories and consequences, Edward Elgar, Cheltenham, pp. 65-90.
International Budget Partnership 2015, Open Budget Survey 2015, International Budget Partnership, Washington DC.
International Budget Partnership 2018a, Open Budget Survey 2017, International Budget Partnership, Washington DC.
International Budget Partnership 2018b, Australia Open Budget Survey 2017 Country Summary, International Budget Partnership, Washington DC.
International Budget Partnership 2018c, Australia Open Budget Survey 2017 Questionnaire, International Budget Partnership, Washington DC.
International Budget Partnership 2018d, New Zealand Open Budget Survey 2017 Country Summary, International Budget Partnership, Washington DC.
Khagram, S, Fung, A & de Renzio, P 2013, Open budgets: the political economy of transparency, participation, and accountability, The Brookings Institution, Washington DC.
Marchessault, L 2014, Public participation and the budget cycle: lessons from country examples, Global Initiative for Fiscal Transparency, Washington DC.
Petrie, M & Shields, J 2010, ‘Producing a citizens’ guide to the Budget: why, what and how?’, OECD Journal on Budgeting, vol. 10, no. 2, pp. 1-15.
Reinikka, R & Svensson, J 2004, ‘The power of information: evidence from a newspaper campaign to reduce capture’, World Bank Policy Research Working Paper no. 3239, World Bank, Washington DC.
Seifert, J, Carlitz, R & Mondo, E 2013, ‘The Open Budget Index (OBI) as a comparative statistical tool’, Journal of Comparative Policy Analysis: Research and Practice, vol. 15, no. 1, pp. 87-101.
Stewart, M & Wong, TC 2018, Open Budget Survey 2017 Part 1: How Transparent is the Australian Budget?, Austaxpolicy: Tax and Transfer Policy Blog, 20 March 2018, Available from: http://www.austaxpolicy.com/open-budget-survey-2017-part-1-transparent-australian-budget/
Stewart, M & Wong, TC 2018, Open Budget Survey 2017 Part 2: What Can Australia Do to Improve Our Budget Process?, Austaxpolicy: Tax and Transfer Policy Blog, 2 May 2018, Available from: http://www.austaxpolicy.com/open-budget-survey-2017-part-2-budget-process/
Wilkinson, J 2018, ‘Fiscal transparency and the Parliamentary Budget Office’, Address at the launch of the Open Budget Survey for Australia, Crawford School of Public Policy, Australian National University, Canberra, 20 March, https://www.aph.gov.au/~/media/05%20About%20Parliament/54%20Parliamentary%20Depts/548%20Parliamentary%20Budget%20Office/Presentations/Fiscal%20transparency%20and%20the%20PBO%20PDF.pdf?la=en.


Recent Comments