How many people receive payments?
Part 1 in this series looked at how much is spent on social security in Australia and how spending has developed over time. This Part 2 looks at how many people receive social security and related payments.
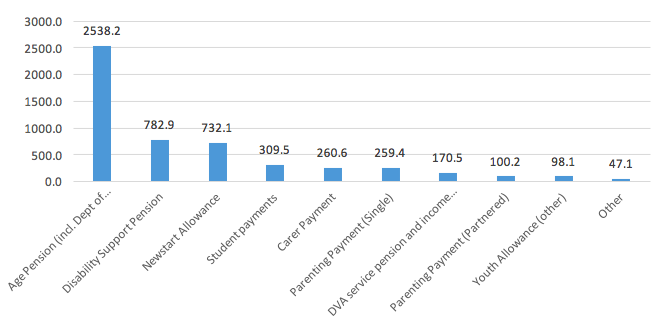
Figure 1 shows the number of recipients of the main income support payments at 30 June 2016, derived from administrative data from the Department of Social Services and data from the Department of Veterans Affairs.
In total, around 2.7 million people receive either an Age Pension or a Department of Veterans Affairs Service Pension, and around 2.6 million people receive other “working age” income support. In addition, there are around 1.54 million families with nearly 3 million children receiving either or both Family Tax Benefit Part A or Family Tax Benefit Part B, although 680 thousand of those families are also receiving an income support payment and 855 thousand are receiving FTB only.
Figure 1: Recipients (000s) of main income support payments, June 2016
Source: DSS Payment Demographic data https://data.gov.au/dataset/dss-payment-demographic-data
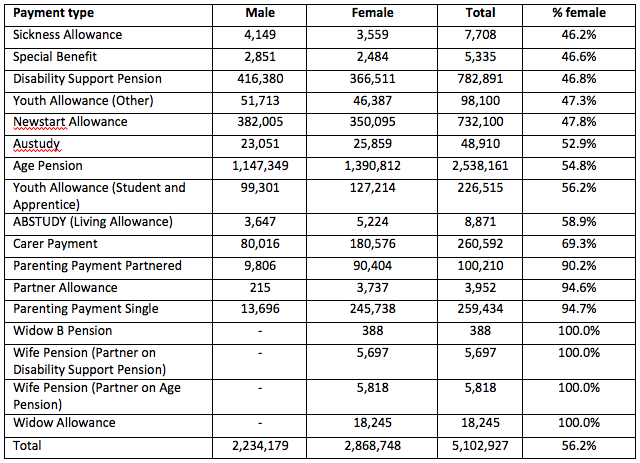
Table 1 shows the number and share of recipients by gender at 30 June 2016. Overall, 56.2% of all recipients of payments from the Department of Social Services were women. There are five payments where women are less than 50% of recipients – Sickness Allowance, special Benefit, Disability Support Pension, Youth allowance (Other) and Newstart Allowance, with women being a majority of the recipients of all other payments.
Table 1: Recipients by payment type by gender, June 2016
Source: DSS Payment Demographic data https://data.gov.au/dataset/dss-payment-demographic-data
Table 2 shows the age distribution of recipients by payment type at June 2016. The recipiency rate is somewhat higher for people aged 16 to 24 years than for other age groups up to the age of 54 years. This is due to the fact that people receiving assistance as students are likely to be in this younger age groups. If students are excluded, then the rate of recipiency for those aged 16 to 24 years drops from 17.7% to just over 10%. Rates of income support receipt therefore tend to rise with age, being around 20% for those aged 55 to 64 years and much higher for those aged 65 years and over.
Table 2: Recipients by payment type by age group, June 2016

Source: DSS Payment Demographic data https://data.gov.au/dataset/dss-payment-demographic-data
Trends in receipt of payments
To understand changes in welfare spending we need to factor in changes in the context in which welfare dollars are spent – population growth and the impact of an ageing population, for example, and changes in government policies and welfare categories.
One approach draws on the fact that in any year, by definition, the total amount of money spent on a social security program is equal to the number of people receiving the payment multiplied by the average amount of money they are paid. Using this simple arithmetic, it’s possible to look at the factors that determine the number of people receiving benefits and identify what influences the amounts they are paid (Saunders, 2017; McCashin, 2012).
The number of people receiving payments reflects interactions between Australia’s growing population and changes in the age composition of the population. In this context, Table 3 shows changes in the size of the total population, the size of the working age population, and of the population 65 years and over between 1980 and 2016, as well as from just before the GFC.
Table 3: Changes (%) in the size of the Australian population by age composition, 1980 to 2016

Source: Calculated from Australian Bureau of Statistics (2017), Australian Demographic Statistics, June 2016, Cat. No. 3101.0
Since 1980, the total Australian population has grown by nearly two-thirds (1.8% per year) and the size of the working age population grew by a little more than this (1.9% per year); the population of age pension age has grown by just over 160% (4.5% per year). Since the GFC, the total population has grown by 15.8% (1.8% per year), the working age population by 13.5% (1.5% per year), and the pension age population by 34.8% (3.8% per year).
Other important factors affecting the number of people receiving social security payments include trends in the job market and in family structure, and the impact of government decisions about who is eligible for payments, as well as changes in other parts of the welfare system. The way individuals respond to changing incentives within the welfare system also affects patterns of payment.
The average level of payments will mainly reflect government decisions about benefit levels and income tests. (It’s important to remember that Australia’s income testing of benefits means that the average level of payments will always be lower than the basic rate of entitlements.)
One of the more important decisions governments make is which indexing approach they will use to ensure that payments reflect changes in community living standards. A number of major payments – the age pension, the disability support pension, and the carer payment – are currently indexed to wages, while most other income-support payments and family payments are indexed to prices. As long as real wages are rising, payments indexed to earnings will rise in real terms – as will the overall cost of those payments, but even if payments are indexed to prices, the overall cost will rise, assuming the population isn’t falling. In these circumstances, the only ways to avoid the payment’s overall cost rising faster than inflation is either to cut the proportion of the population receiving the payment (for example, by changing eligibility rules) or to cut average benefits in real terms. This would involve either cutting rates of payments – which would most disadvantage the lowest income groups – by tightening income tests – which may be counter-productive if recipients reduce their incomes due to greater disincentives to work – or by enabling greater work effort through employment growth.
We also need to look at the system as a whole, and not just its parts. This is particularly important because Australia has a categorical system of income-support payments. To be eligible for a payment, an individual needs to fall into a defined group – by being over the age of sixty-five, for example, or having a disability, or caring for someone with disability, or being unemployed or sick, or studying, or caring for children. There is also a payment – special benefit – for low-income people who don’t satisfy the criteria for any of the other categories.
For any one person, these categories are mutually exclusive. An individual can simultaneously be over the age of sixty-five and have a disability that prevents him or her from taking paid work, for example, and a lone parent can also be looking for full-time work or caring for someone with disability. But these individuals can only receive one of the categorical income-support payments, even if they are potentially eligible for more than one. This means that when policy changes and a payment is either abolished or phased out, or eligibility conditions are tightened, individuals may be entitled to claim a different payment. This also applies to groups of people at different times: following a change of policy, a class of people who might previously have been able to claim one type of payment might be eligible for another payment. If we only analyse one payment at a time we overlook this potential substitution and gain a very limited view of what is actually going on in the welfare system.
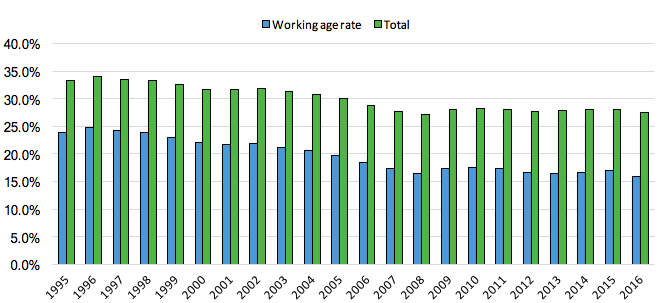
Figure 2: Trends in the proportion (%) of the population and people of working age receiving an income support payment, Australia, 1995 to 2016
Note: The population receiving working age payments is adjusted to include women aged 60-64 and receiving an age pension in all years and to exclude people aged 65 and over receiving Disability Support Pension, Carers and other payments. Source: Department of Social Services, Income Support Customers: A Statistical Overview (various years) https://www.dss.gov.au/publications-articles/research-publications/statistical-paper-series; DSS Payment Demographic data https://data.gov.au/dataset/dss-payment-demographic-data and Australian Bureau of Statistics (2017), Australian Demographic Statistics, June 2016, Cat. No. 3101.0.
At 30 June 2016 27.5 per cent of the adult population were receiving an income support payment. As shown in Figure 2, with the exception of the year immediately before the Global Financial Crisis (when it was 27.2%), this is the lowest rate of receipt of income support in the last 20 years. Since the 1990s, overall rates of receipt for the adult population have fallen from 34.1 per cent in 1996, while rates for the working age population have fallen from 24.9% to 16%, which is lower than in 2008.
Figure 3 shows trends in rates of receipt for the population 65 and over, which fell from 84.2 % to 76.1% between 1995 and 2016. The decline in coverage of payments appears to largely reflect a large fall in the coverage of Department of Veteran’s Affairs payments, as the cohort who fought in World War II die. The share of the older population receiving DVA payments has fallen from close to 20% to under 5%, while the share receiving Age Pensions has risen less significantly from 64% to 69%.
Age pensions are alternatives to service pensions. But the fact that the increase in the share receiving age pensions was only about half the size of the decline in the share receiving service pensions suggests that potential new entrants to pensions are better off than previous groups of people turning sixty-five. And, as compulsory superannuation increases retirement resources in future years, the share of older people receiving an income-tested payment is likely to decline further – although the full effect will not be seen until after 2030 when retirees will have had the opportunity to contribute over their full working lives.
Figure 3: Trends in the proportion (%) of the population of pension age receiving an income support payment, Australia, 1995 to 2016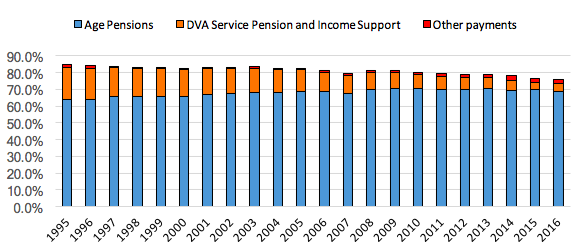
Note: The population is adjusted to exclude women aged 60-64 and receiving an age pension in all years and to include people aged 65 and over receiving DSP, Carers and other payments (all included in “Other”). Source: Department of Social Services, Income Support Customers: A Statistical Overview (various years); DSS Payment Demographic data https://data.gov.au/dataset/dss-payment-demographic-data. Numbers of DVA Service Pensioners and those receiving the Income Support Supplement are from DVA, Pensioner Summary Statistics, various years, https://www.dva.gov.au/about-dva/statistics-about-veteran-population; and Australian Bureau of Statistics (2017), Australian Demographic Statistics, June 2016, Cat. No. 3101.0.
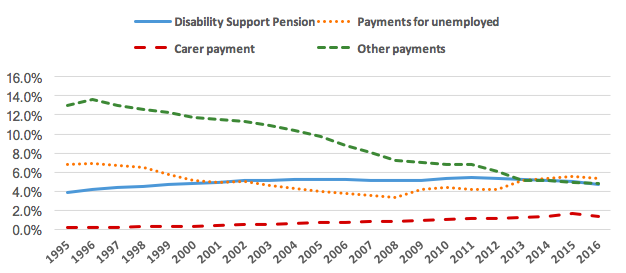
Figure 4 breaks down trends since 1995, showing what has happened to the share of the working-age population receiving the DSP, the share receiving unemployment-related payments, the share receiving the carer payment, and the percentage receiving any other form of working-age income support, including parents, the sick, wives, widows, partners and recipients of student assistance.
Figure 4: Trends in the proportion (%) of the population of working age receiving an income support payment, by type of payment, Australia, 1995 to 2016
Source: Calculated from Department of Social Services, Income Support Customers: A statistical Overview (various years); DSS Payment Demographic data https://data.gov.au/dataset/dss-payment-demographic-data and Australian Bureau of Statistics (2017), Australian Demographic Statistics, June 2016, Cat. No. 3101.0
What is apparent is a fairly steady rise in the share of people on the DSP, from 3.9 per cent of the working-age population in 1995 to a peak of 5.4 per cent in 2011, falling to about 4.7 per cent in 2016. The number of people of working age on this payment fell from 800,000 in 2012 to 736,000 in 2016.[1]
The long decline in the share of the working-age population receiving unemployment payments before the GFC is also apparent, with an increase in 2008–09 and a sharper increase between 2012 and 2013. The proportion of people on the carer payment rose from a negligible 0.2 per cent of the working-age population in 1995 to 1.4 per cent in 2016.
What is most striking, however, is the trend in the number receiving “other” payments, which peaked at 13.6 per cent of the population in 1996 but had fallen to 4.8 per cent by 2016. In numerical terms, the number of people receiving these benefits has fallen from 1.6 million in 1996 to 755,000 in 2016. The improvement in labour-market conditions between 1996 and 2008 is likely to have contributed to the decline in the share of working-age people on these other payments, but policy changes appear to be the most important factor.
Starting in the 1980s and continuing for more than twenty years, the federal government began phasing out a number of other payments or limiting access to new claimants. Access to Widow B pension, for example, was limited in 1987, and then closed to new entrants in 1997. In 1994, the government introduced the partner allowance to provide support to the partners of beneficiaries who had previously received a “married rate” of payment; then, in 1995, it restricted this to older women without recent workforce experience while introducing Parenting Payment Partnered for partners with dependent children. As well as phasing out these payments, the government changed the income test for unemployment payments in 1995 to require both individuals in a couple to claim the benefit in their own right, and part of their individual earnings did not affect their partner’s benefit entitlements.
A further important change was the increase in the age pension qualifying age for women from sixty to sixty-five. Before 1995, women receiving the DSP were required to shift to the age pension once they turned sixty, and women who became disabled after turning sixty weren’t able to claim the DSP unless they had lived in Australia for less than the ten years needed to qualify for an age pension.
As the cut-off age started to increase, women with disabilities in this age group increasingly claimed the DSP; the proportion rose from close to zero to 13.3 per cent by 2013. (Age breakdowns by gender are not available for subsequent years.) But as the number of women receiving the DSP went up, the number receiving the age pension went down – and it went down by much more.
In 1995, only about 650 women aged sixty to sixty-four received the DSP and 212,000 received the age pension. By 2013, 86,000 women in that age group received the DSP, and since 2014 none have received the age pension. Where once 67 per cent of women of that age received a pension or other payment, now the figure is less than half that. Overall, close to a quarter of the growth in the number of DSP recipients over the past twenty years can be accounted for by the growth in the number of women aged sixty to sixty-four receiving the DSP rather than the age pension.
The wife pension was closed to new entrants in 1995; the partner allowance and the mature age allowance were closed to new claimants in 2003; and by 2008 there were no longer any recipients of the mature age allowance. Since 2005, new grants of the widow allowance have been limited to women born on or before 1 July 1955.
Most of these payments had effectively been based on the assumption that women were “dependents” of men, or in the case of widows that they had been dependent and should not be expected to look for work. Even the lower age for women to receive the pension had been partly based on the assumption that women would want to leave the workforce at roughly the same time as their assumed older husbands.
These changes had a profound impact not only on the total number of people receiving welfare payments but also on which payments they received. In the mid-1990s, the “closed payments” – mainly for women – were received by around 4 per cent of the working-age population; now, only 1 per cent of the population receive their successor payments.
About 1.4 per cent of the working-age population are receiving the carer payment. As with the age pension/DSP trade-off for older women, the rise in the number of people on the carer payment is more than offset by the decline in the number of people on these “dependency” payments.
What these figures show is that if we only look at the programs in which numbers have been going up – the DSP, the carer payment and, more recently, unemployment payments – then we will have a very partial view of overall trends and miss the contribution of policy changes in other parts of the system.
What has happened to family payments?
In recent decades, there has been a good deal of public discussion of “middle class welfare”, with critics particularly pointing to the growth in spending on family payments (Redmond, Whiteford and Adamson, 2011). As discussed earlier, spending on assistance for families increased significantly in Australia between the 1980s and the early 2000s – in fact the increase in spending was the most rapid in the OECD.
But earlier discussion also showed that spending as a percentage of GDP peaked in 2003, and has generally fallen since then (with the temporary exception of the year of the GFC). In fact, the reduction in spending on family payments over the past 14 years, has also been the most rapid of any OECD country.
A number of policy initiatives have led to this result, including the decision in 2009 to change the indexation of family payments from wages to prices, the non-indexation of the higher threshold for income-testing family payments in 2011, the imposition of “sudden death” income tests on Family Tax Benefit Part B, first at $150,000 under the Labor Government, and then at $100,000 under the Coalition government, and a range of proposed changes since 2013.
These changes have had a remarkable impact on eligibility for family assistance. As Figure 9 shows the proportion of all children for whom Family Tax Benefit Part A is paid has fallen significantly both over the longer run and more recently.
Families are eligible for Family Tax Benefit Part A if they have dependent children aged zero to 15 years and/or dependent students up to 18 years of age. As there is no readily available data on the number of dependent students – and the precise rules of eligibility have changed over time – it is only possible to estimate a range of coverage estimates, not a precise measure of coverage (the proportion of eligible children for whom payments are received).
Figure 5 shows estimated coverage taking the number of children for whom payments are made as a percentage of all children aged 0 to 15 years – which will be an over-estimate – and as a proportion of all people aged 0 to 18 years – which will be an under-estimate. The “true” coverage rate will fall somewhere between these two lines, which track each other quite closely.
Up until 1987, when the Hawke government introduced an income test on Family Allowances, coverage was effectively universal. The introduction of the income test on payments saw coverage drop to between 70% and 80%. There was a relatively brief period of stability up until 2007, but since then coverage has again dropped due to the policy changes outlines above.
Figure 5: Estimated coverage (%) of children by Family Tax Benefit Part A and related payments, 1971 to 2016
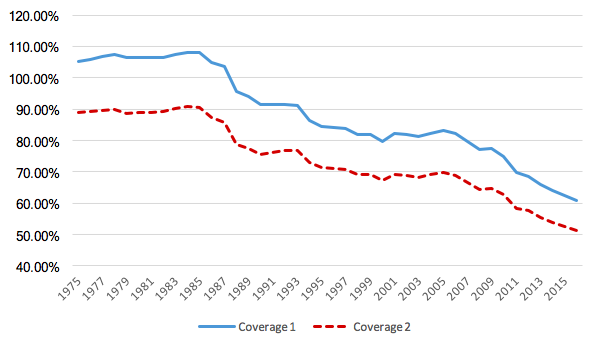
Note: Families are eligible for Family Tax Benefit Part A if they have children aged 0 to 15 years (inclusive) and/or dependent students aged 0 to 18 years. “Coverage 1” is the number of children for whom Family Tax Benefit Part A and earlier equivalent payments is paid as a percentage of the population aged 0 to 15 years; “Coverage 2” is as a percentage of the population 0 to 18 years. Source: Department of Social Services, Income Support Customers: A Statistical Overview (various years) https://www.dss.gov.au/publications-articles/research-publications/statistical-paper-series; DSS Payment Demographic data https://data.gov.au/dataset/dss-payment-demographic-data and Australian Bureau of Statistics (2017), Australian Demographic Statistics, June 2016, Cat. No. 3101.0.
In the recent period, the number of children for whom Family Tax Benefit Part A are paid has fallen from around 3.5 million in 2006 to just over 2.9 million in 2016, while the number of children less than 15 years of age has increased from 4.0 million in 2006 to 4.5 million in 2016. This means that the “coverage rate” of FTBA among children up to 15 years of age has fallen from around 83 per cent to close to 61 per cent, or from 70% to closer to 50% of children aged up to 18 years. It seems likely that due to the continuing non-indexation of the upper income test threshold for family payments, that this trend will continue in future.
[1] Interestingly, the number of people aged sixty-five and over who receive the DSP rose from around 4000 in 1995 to nearly 47,000 in 2016, presumably because they have not lived in Australia long enough to receive an age pension, but acquired a disability after they settled here.
This article is based on Whiteford, P (2017): Social security and welfare spending in Australia: assessing long-term trends, TTPI Policy Brief 1/2017. Read Part 1, Part 3, Part 4 and Part 5.
References
Australian Bureau of Statistics (2017), Australian Demographic Statistics, June 2016, Cat. No. 3101.0, Canberra.
Department of Social Services (various years), Income Support Customers: A Statistical Overview https://www.dss.gov.au/publications-articles/research-publications/statistical-paper-series, Canberra.
Department of Social Services (various years), DSS Payment Demographic data https://data.gov.au/dataset/dss-payment-demographic-data, Canberra.
McCashin, A. (2012), “Social security expenditures in Ireland, 1981–2007: an analysis of welfare state change”, Policy & Politics, Volume 40, Number 4, October 2012, pp. 547-567(21).
OECD (2017), OECD Social Expenditure database, Data extracted on 30 Apr 2017 from OECD.Stat, http://stats.oecd.org/Index.aspx?DataSetCode=SOCX_DET# Paris.
OECD Social Expenditure Update, 2014, http://www.oecd.org/els/soc/OECD2014-SocialExpenditure_Update19Nov_Rev.pdf Paris.
Redmond, G., Whiteford, P. and E. Adamson (2011), “Middle Class Welfare in Australia: How has the Distribution of Cash Benefits changed since the 1980s?” Australian Journal of Labour Economics, Vol. 14, No. 2, 2011: 81-102.
Saunders P. (2017), ‘Understanding social security trends: an expenditure decomposition approach with application to Australia and Hong Kong‘, Journal of Asian Public Policy, vol. 10, pp. 216 – 229.


Recent Comments