

Budget 2018-19 delivers tax rate cuts into the future that will seem attractive to many. But these tax cuts will benefit high income earners much more than low earners and they further dismantle the structure of our progressive income tax.
While cutting taxes, the budget achieves fiscal balance by limiting spending excessively, at the expense of good government and the poorest in our society. It also puts a straitjacket on tax reform.
The tax to GDP cap
First, let us consider the 23.9% “speed limit” or “cap” on Australia’s tax to GDP ratio. The cap is supposed to limit Commonwealth taxes as a share of GDP once a budget surplus is reached – estimated by the Government to be in 2019-20.
Australia’s Charter of Budget Honesty aims for prudent budgeting in the medium to long term but does not legislate a fiscal rule. Usually, fiscal rules seek to limit deficits to balance revenues and expenditures over the business cycle, or to restrict public debt to pay for capital investment and not current expenditures such as salaries or social security. The OECD recommends limits on debt and expenditures to help ensure sustainable budgeting.
The tax “cap” is not legislated and it does not support prudent budgeting. It leaves government the option of using debt to finance expenditure. Instead, the 23.9% tax to GDP cap aims to limit the size of government by keeping taxes arbitrarily low. A tax to GDP cap at this level was recommended by the National Commission of Audit, established in 2013 by then-Treasurer Joe Hockey with precisely this goal.
There are precedents for the tax cap by governments on both sides of politics. From 1985 to 1988, the Hawke-Keating government committed to a “trilogy” capping taxes, spending and debt. That political commitment, which was not fully met, had the goal of maintaining the tax level over the electoral cycle to support a tax reform package. The package both lowered marginal rates and broadened the tax base, including the Capital Gains Tax, Fringe Benefits Tax and significant company and international tax reforms.
What is the right tax level for Australia?
My students ask me how much tax is the right level for fair government and economic growth. There is no clear answer: it depends. Many countries, with high levels of economic growth, wellbeing and equality and lower unemployment, have higher tax to GDP ratios than Australia.
The chart below compares the total tax level (including State and local taxes) for Australia and comparable OECD countries, from 2000 to 2016. Australia has a much lower tax to GDP ratio than Canada, the United Kingdom, New Zealand, Germany, France, Japan, and Sweden (the black line is the OECD average). The United States has lower taxes overall but a far greater fiscal deficit – it finances government with debt.
Figure: Tax levels, selected OECD countries, 2000-2016
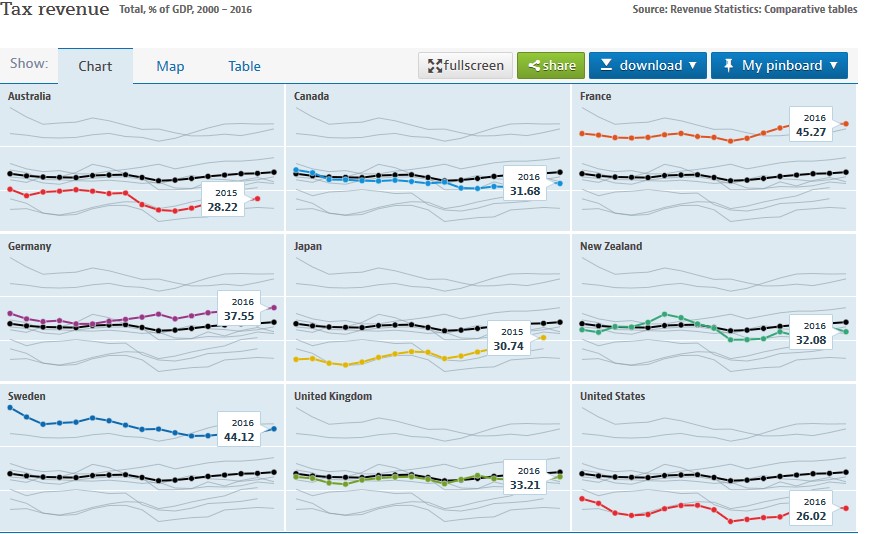 Source: OECD Revenue Statistics.
How does our tax level compare with historical levels?
The federal tax cap of 23.9% of GDP is an average of tax levels since 2000. If we averaged tax levels over the last century, this would produce a cap of about 15% of GDP, starting from the very low federal tax level of 4% of GDP at federation. This is shown in the next chart.
We know that we should not be reducing our tax level. Low income countries, in general, have much lower tax to GDP levels than Australia, for example Indonesia (11.8% of GDP) or the Philippines (17% of GDP). They face challenges in collecting taxes and in addressing poverty, inequality and poor infrastructure and services, with this low level of revenue.
Figure: Tax levels since federation: % of GDP
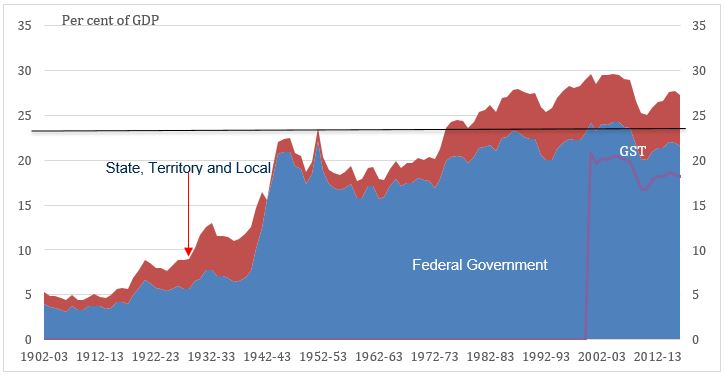 Source: Tax and Transfer Policy Institute, A Stocktake of the Tax System and Directions for Reform (2015) Chart 3.2, updated to 2016-17 using budget and ABS data.
This chart shows how Australia’s tax level has grown and changed as Australia has grown and developed as a nation. Revenues change over time as a result of law reform, economic conditions and administrative developments. They dip during crises – such as the Global Financial Crisis (GFC) in 2008 – and then recover.
Our tax revenues continued to decline in the last two years and did not recover quickly after the GFC. This year, the good news is the budget shows a small recovery in revenues because commodity prices and company tax revenues have picked up. But it is not clear what will happen in the future.
The black line on the chart shows that a Commonwealth tax level exceeding 23.9% of GDP was reached under the Howard-Costello government in several years during the 2000s. It seems likely we will need to increase our tax level somewhat in future, to ensure fairness and sufficient investment in Australia, in a changing and risky world with an ageing population. At least, this is a debate we should have.
Flattening our progressive income tax
What of the tax cuts? Periodic increases in tax thresholds are common, to return “bracket creep” to taxpayers as nominal income rises. However, the removal of the 37% tax rate is a different matter. The government’s personal tax rate cuts, if fully implemented, would flatten our income tax rate structure more than ever in the past.
A progressive tax means that the share of income paid in tax increases, as income increases. Australia’s graduated, progressive income tax dates back more than a century. The graduated tax rates at the middle and top of the income distribution deliver progressivity across our whole tax system, while our need based, means-tested social security system delivers progressivity at the bottom of the distribution. The economic case for this tax rate cut is not made: there is no empirical evidence that marginal tax rates on moderately high incomes, of between 35% and 50% cause significant inefficiencies or discourage work or investment.
The proposed Low and Middle Income Tax Offset which will apply over the next three years is targeted to those on lower incomes. However, the removal of the 37% rate bracket is not targeted to middle income earners. Instead, it permanently lowers the tax that upper middle and high income taxpayers must pay. The change is shown in the next chart.
Figure: Marginal and average tax rates, 2017-18 compared to 2024-25
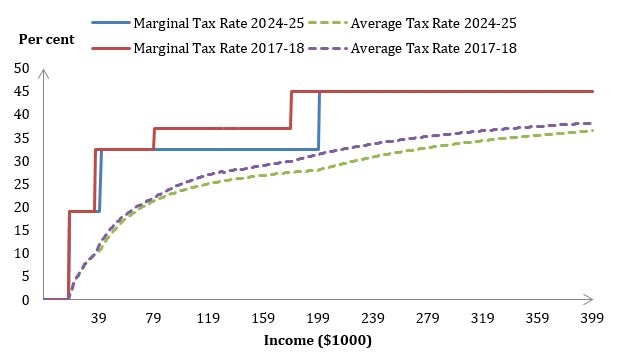 Source: Tax and Transfer Policy Institute, Stocktake Report 2015 Figure 1.1, updated.
Using the tax calculator on the budget website, a person with taxable income of $220,000 will save more than $7,000 a year. That is a permanent change that makes the income tax less able to deliver progressivity overall.
Tax cuts but no tax reform
The personal tax rate cuts bring our income tax system close to the flattened rate structure that was proposed by the Henry Tax Review in 2009. But even if you support a flatter rate structure, the Government’s proposal is very different from the Henry proposal.
Figure: Henry Tax Review recommended rate structure
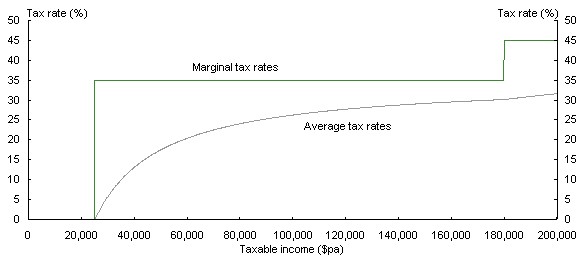 Source: Final Report, Chart 4.1.
The Henry Review recommended rate cuts as part of a set of base-broadening tax reforms including:
- A more comprehensive personal income tax base that taxes capital incomes (earned more by higher income earners) more fairly and evenly
- simplifying the income tax by removing offsets and limiting deductions
- taxing mineral and petroleum resources more effectively and exploring a tax on wealth
- supporting State tax reform including of land tax, and
- carbon, fuel and other environmental tax measures.
The Government is not proposing any such reforms.
Effective marginal tax rates and workforce participation
Many women will benefit from the Low and Middle Income Tax Offset and the threshold increase for the 19% rate to $41,000. But women will benefit much less than men at the top of the income distribution.
Women with children face high effective marginal tax rates when they seek to return to work or increase their work hours and face childcare costs and losing family payments tested on family income, as well as paying income tax. Female workforce participation is increasing, but women still make up about 70% of all part time workers and 46.5% of women participating are working part-time.
More important than the tax cuts for most women is the effect of the Government’s childcare package, starting in July 2018. This package should improve the situation for women and families with low incomes, but still puts obstacles in the way of women in middle income dual earner households.
The biggest losers from a tax cut budget are those who do not have any tax to cut: the poorest 10% of the community. That includes those seeking work and sole parents on Newstart, which has not been increased in the budget and is now declining in real terms.
Tax cap and tax cuts put a straitjacket on tax reform
The tax to GDP cap at 23.9% covers all federal taxes including the GST. The chart above shows that GST revenue has been declining as a share of GDP since it was introduced in 2000, as the population ages and households spend more on tax-exempt health, education and food.
The Government says that the GST is a State tax, but including GST in the cap means that if State Treasurers did take it upon themselves to broaden the base or increase the rate of the GST, they would run smack into the federal government cap, unless other taxes were cut further. The cap is also a disincentive for the State governments to reform their stamp duty and land taxes.
Taxes are our fairest and most effective, and efficient, ways of financing government. Federal Government leadership is needed in tax reform but the Treasurer has made broad-based tax reform more difficult with this budget, while taking the political benefit of tax rate cuts that can only be justified by such reform.
More from our Budget Forum 2018 series:
Budget Forum 2018: This is not a Genuine or Equitable Way to Simplify the Personal Income Tax System by Andrew Podger
Budget Forum 2018: A Missed Opportunity for Enhancing Australia’s Budget Transparency on Distributional Information by Teck Chi Wong
Budget Forum 2018: Targeting the Black Economy by Joel Emery
Budget Forum 2018: Risks Greater Than I Can Recall in My Working Life by John Hewson
Budget Forum 2018: Should Australia Produce a Citizen’s Climate Budget? by Usman W Chohan
Budget Forum 2018: The Future of Corporate Taxation by David Ingles
Budget Forum 2018: Cuts to Personal Income Tax – A Mixed Bag by Robert Breunig
Budget Forum 2018: A Political Budget Unlikely to Work Politically by John Hewson
Budget Forum 2018: The Government Could Be Boosting the Budget Bottom Line with a Change to How It Taxes Gas by Diane Kraal


Pingback: Post-budget review | ANU-CPD POLICY DIALOGUE | May 2018 - Centre for Policy Development
Pingback: Budget Forum 2018: Risks Greater Than I Can Recall in My Working Life - Austaxpolicy: The Tax and Transfer Policy Blog
Pingback: Budget Forum 2018: Should Australia Produce a Citizen’s Climate Budget? - Austaxpolicy: The Tax and Transfer Policy Blog
Pingback: Budget Forum 2018: The Future of Corporate Taxation - Austaxpolicy: The Tax and Transfer Policy Blog
Pingback: Budget Forum 2018: A Political Budget Unlikely to Work Politically - Austaxpolicy: The Tax and Transfer Policy Blog
Pingback: Budget Forum 2018: The Government Could Be Boosting the Budget Bottom Line with a Change to How It Taxes Gas - Austaxpolicy: The Tax and Transfer Policy Blog
Pingback: Budget Forum 2018: Targeting the Black Economy - Austaxpolicy: The Tax and Transfer Policy Blog
Pingback: Budget Forum 2018: A Missed Opportunity for Enhancing Australia’s Budget Transparency on Distributional Information - Austaxpolicy: The Tax and Transfer Policy Blog
Pingback: Budget Forum 2018: This is not a Genuine or Equitable Way to Simplify the Personal Income Tax System - Austaxpolicy: The Tax and Transfer Policy Blog
Thank you for the article! I am studying the tax system in Australia, in your article I found answers to some questions.