

How does Australia compare?
The Australian social security system differs from those in most other countries. In Europe, the United States and Japan, most government benefits are financed by contributions from employers and insured employees, and benefits are often related to past earnings, so that higher income workers receive higher absolute levels of benefits if they become unemployed or incapacitated or when they retire.
In contrast, in Australia (and New Zealand), most government benefits are flat-rate entitlements financed from general government revenue, and there are no explicit social security taxes. In addition, in both countries – but more so in Australia – most benefits are income-tested or asset-tested, so that entitlements reduce as resources increase (Whiteford 2010).
While income support payments are means-tested, these assets tests are more generous than those typically applying in social assistance schemes in other countries. In a sense, the Australian system is a hybrid falling between a social insurance system and a social assistance system, being less “generous” than a social insurance system, but more “generous” than a social assistance system.
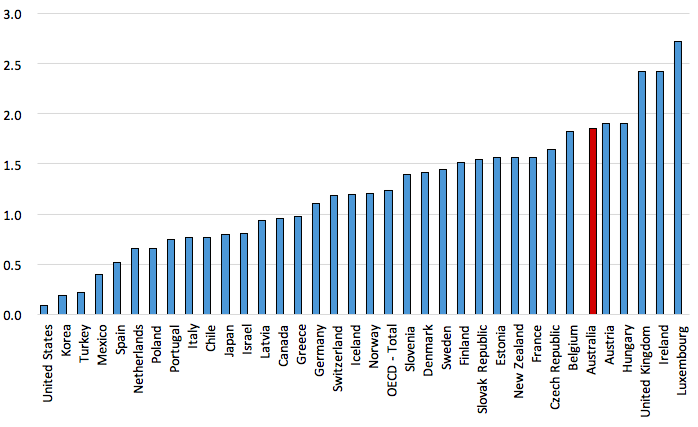
Figure 1 shows spending on cash benefits as a percentage of GDP in 2014. Australia is the 6th lowest spender of 35 OECD countries, spending slightly more than Turkey and slightly less than Israel. The lowest spending countries tend to be those OECD countries with the lowest levels of national income such as Mexico, Korea and Chile. The English-speaking countries tend to be relatively low spenders on social security benefits, but Australia is the lowest spender in this group.
Figure 1: Spending on cash benefits, OECD, 2014 or nearest year (% of GDP)
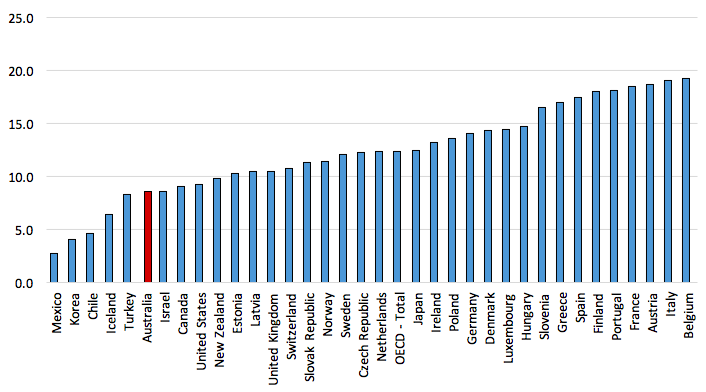
Source: OECD Social Expenditure database, Data extracted on 30 Apr 2017 from OECD.Stat, http://stats.oecd.org/Index.aspx?DataSetCode=SOCX_DET#
Figure 2 shows how Australian spending on cash benefits compares to the OECD average between 1980 and 2014. In broad terms, trends in Australia social security spending parallel those for the OECD overall, although the increase in spending in the recession of the early 1990s was more marked in Australia. The increase at the time of the GFC was initially less strong in Australia, but increased somewhat after 2010. Over the whole period, spending increased from around 60% to 69% of the OECD average.
Figure 2: Spending on cash benefits, Australia compared to OECD average, 1980 to 2014 (% of GDP)
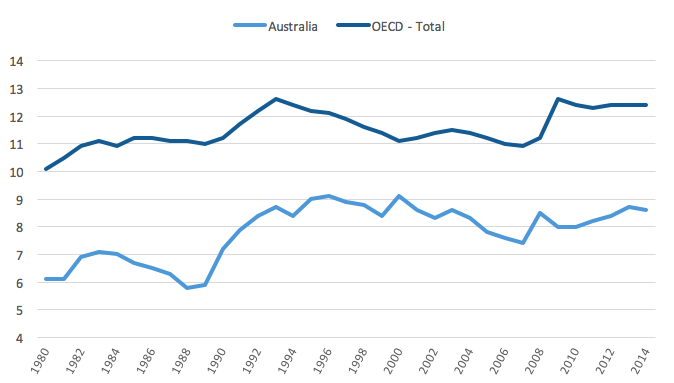
Source: OECD Social Expenditure database, Data extracted on 30 Apr 2017 from OECD.Stat, http://stats.oecd.org/Index.aspx?DataSetCode=SOCX_DET#
Figures 3 to 6 compare Australian spending on the main categories of cash benefits in 2014 (or the nearest year).
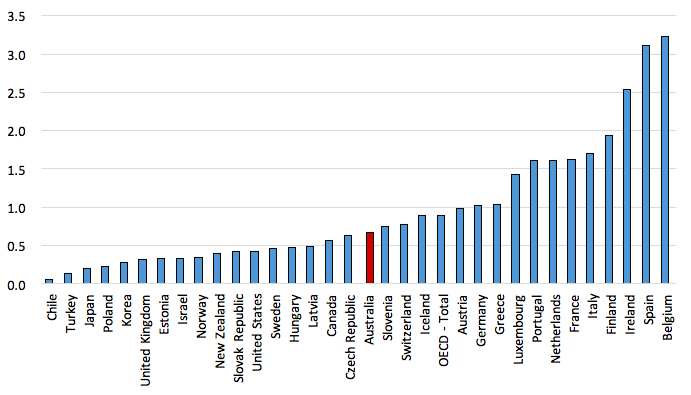
Cash benefits for the aged (Figure 3) are the most important spending item in Australia and most other OECD countries. Australia ranks 5th lowest in the OECD, with the main countries that spend less being lower income OECD countries.
Figure 3: Spending on cash benefits for the aged, OECD, 2014 or nearest year (% of GDP)
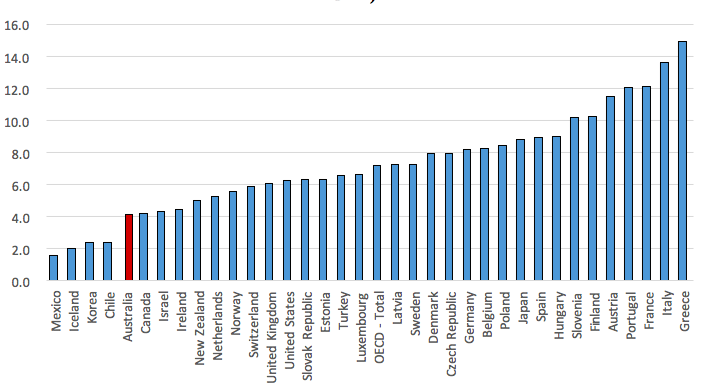
Source: OECD Social Expenditure database, Data extracted on 30 Apr 2017 from OECD.Stat, http://stats.oecd.org/Index.aspx?DataSetCode=SOCX_DET#
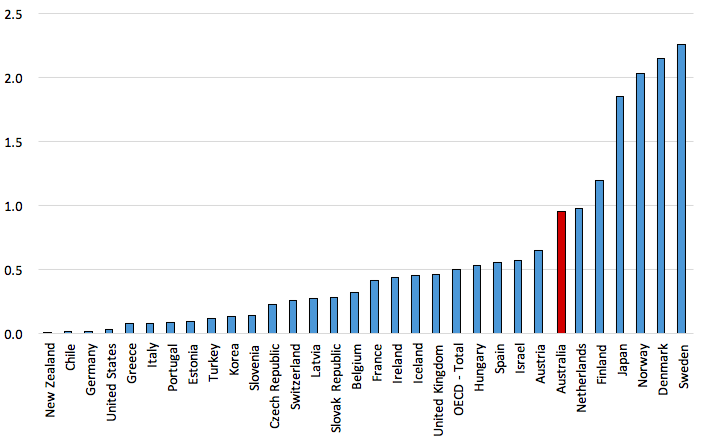
Australian spending on cash benefits for incapacity or disability (Figure 4) ranks 8th highest in the OECD, although to some extent this is influenced by spending on early retirement, where Australian spending is very low. In a number of countries, spending on incapacity is measured as relatively low, because older people with disability are able to retire early rather than claim incapacity benefits.
Figure 4: Spending on incapacity cash benefits, OECD, 2014 or nearest year (% of GDP)
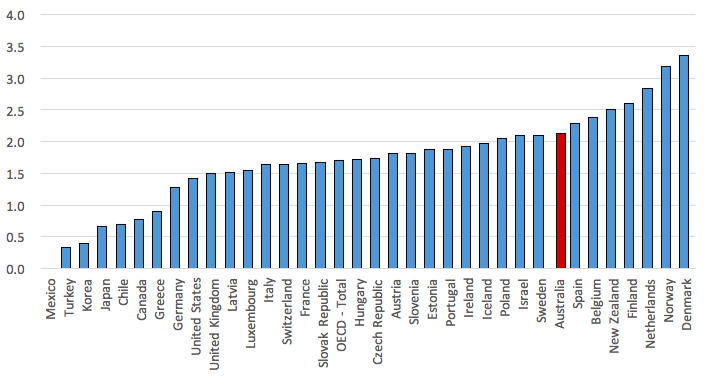
Source: OECD Social Expenditure database, Data extracted on 30 Apr 2017 from OECD.Stat, http://stats.oecd.org/Index.aspx?DataSetCode=SOCX_DET#
For spending on family cash benefits (Figure 5) Australia ranks 6th highest in the OECD. As discussed above, this ranking reflects Australia’s rapid increase in spending up to 2003 (when Australian spending was the 2nd highest in the OECD after Luxembourg). Since 2003, Australian spending has been falling down the OECD ranking. In addition, Australia has one of the lowest levels of spending in the OECD through tax support for families, reflecting the fact that most of the measures that used to be included as payments through the tax system are now made as direct cash payments. When tax breaks are added to cash payments Australia falls from 6th to 10th highest in the OECD.
Figure 5: Spending on family cash benefits, OECD, 2014 or nearest year (% of GDP)
Source: OECD Social Expenditure database, Data extracted on 30 Apr 2017 from OECD.Stat, http://stats.oecd.org/Index.aspx?DataSetCode=SOCX_DET#
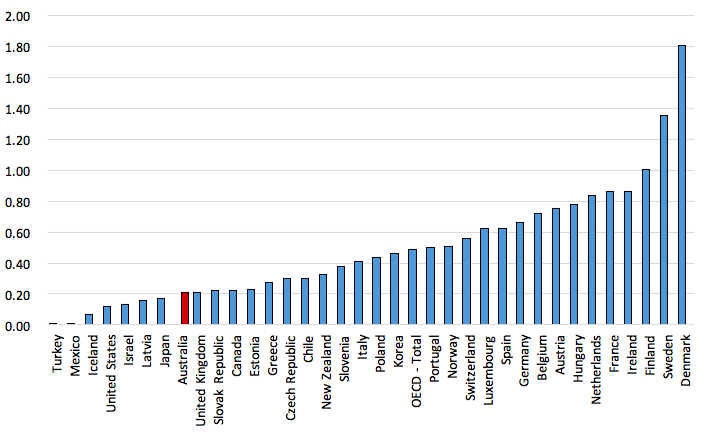
For spending on unemployment cash benefits (Figure 6), Australia is well below the OECD average and ranks 17th in the OECD. This partly reflects Australia’s lower than average unemployment rate, but more importantly, the low level of benefits due to Australia’s flat-rate income tested system.
Figure 6: Spending on unemployment cash benefits, OECD, 2014 or nearest year (% of GDP)
Source: OECD Social Expenditure database, Data extracted on 30 Apr 2017 from OECD.Stat, http://stats.oecd.org/Index.aspx?DataSetCode=SOCX_DET#
Comparing spending on community and welfare services
Australia’s spending on all community and welfare services was the 7th highest in the OECD in 2014, and about 50% higher than the OECD average. All of the Nordic countries and the United Kingdom were higher spenders than Australia. A full breakdown of spending on each category of community and welfare services for different categories of recipient is in the full policy brief, Table A.2 (Page 35).
Figure 7: Spending on community and welfare services, OECD, 2014 or nearest year, % of GDP

Source: OECD Social Expenditure database, Data extracted on 30 Apr 2017 from OECD.Stat, http://stats.oecd.org/Index.aspx?DataSetCode=SOCX_DET#
Figure 8 shows that spending on services for older people is also the 7th highest in the OECD, or about 30% higher than the OECD average. Again most of the Nordic countries are higher spenders than Australia in this category, but so are Japan and the Netherlands. Comparisons across countries for this area of spending is likely to be complicated by the degree to which spending through the health care system is directed to activities supporting the care of older people differentially across countries. It is also possible that in countries with higher levels of spending on pensions for older people may expect people to pay greater out-of-pocket contributions for community care and residential care.
Figure 8: Spending on services for older people, OECD, 2014 or nearest year, % of GDP
Source: OECD Social Expenditure database, Data extracted on 30 Apr 2017 from OECD.Stat, http://stats.oecd.org/Index.aspx?DataSetCode=SOCX_DET#
Figure 9 shows spending on disability services in 2014, when Australia ranked 9th in the OECD, or nearly twice the OECD average. Again the Nordic countries rank at the top of the OECD distribution, but so also do continental European countries, such as Luxembourg, Germany, Switzerland and Belgium.
Figure 9: Spending on services for people with disability, OECD, 2014 or nearest year, % of GDP

Source: OECD Social Expenditure database, Data extracted on 30 Apr 2017 from OECD.Stat, http://stats.oecd.org/Index.aspx?DataSetCode=SOCX_DET#
Figure 10 shows that spending on family services is the 14th highest in the OECD and only slightly above the OECD average. Figure 11 shows that spending on Active Labour Market programmes is the 8th lowest in the OECD and only about 40% of the OECD average. In both these categories of spending, the Scandinavian countries lead the OECD by a wide range.
Figure 10: Spending on family services, OECD, 2014 or nearest year, % of GDP

Source: OECD Social Expenditure database, Data extracted on 30 Apr 2017 from OECD.Stat, http://stats.oecd.org/Index.aspx?DataSetCode=SOCX_DET#
Figure 11: Spending on active labour market programmes, OECD, 2014 or nearest year, % of GDP
Source: OECD Social Expenditure database, Data extracted on 30 Apr 2017 from OECD.Stat, http://stats.oecd.org/Index.aspx?DataSetCode=SOCX_DET#
This article is based on Whiteford, P (2017): Social security and welfare spending in Australia: assessing long-term trends, TTPI Policy Brief 1/2017. Read Part 1, Part 2, Part 3 and Part 5.
References
OECD (2017), OECD Social Expenditure database, Data extracted on 30 Apr 2017 from OECD.Stat, http://stats.oecd.org/Index.aspx?DataSetCode=SOCX_DET# Paris.
OECD Social Expenditure Update, 2014, http://www.oecd.org/els/soc/OECD2014-SocialExpenditure_Update19Nov_Rev.pdf Paris.
Whiteford, P. (2010), ‘The Australian tax-transfer system: architecture and outcomes‘, Economic Record, 86 (275), 528-544. Online ISSN: 1475-4932.


Pingback: From Basic Income to Poor Law and Back Again - Part 4: Designing a Viable Basic Income - Austaxpolicy: The Tax and Transfer Policy Blog