

Distribution of social benefits: How does Australia compare?
The Australian social security system differs from the social insurance systems common in other high income countries, in terms of how benefits are financed and how benefits are distributed between income groups. Figure 1 shows estimates of spending on income-tested payments in 2012.
Australia has the highest level of spending on income-tested benefits of any OECD country in 2012 – 6.5% of GDP, with the next nearest countries being Ireland, Iceland and Canada. The lowest level of spending on income-tested payments at under one per cent of GDP is in Norway, Greece, Denmark and Sweden.
Figure 1: Public spending on income-tested benefits, % of GDP, OECD countries 2012
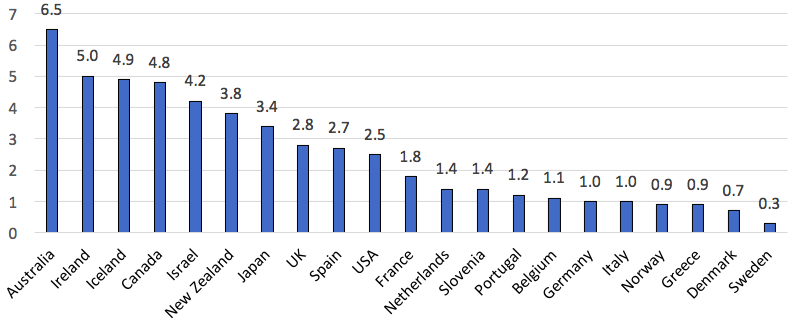
Source: OECD Social Expenditure database.
As a result of Australia’s reliance on income-testing, cash benefits in Australia are more targeted to the poorest 20% of the population than in any other OECD country, and correspondingly, the richest 20% of the population receive a lower share of benefits than in any other high-income country, as shown in Figure 2.
Figure 2: Percentage of public social benefits in cash paid to the lowest and highest quintiles, total population, 2011
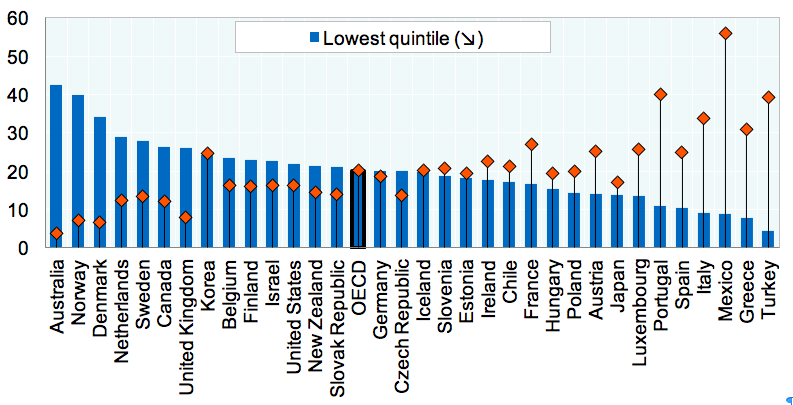
Source: OECD Social Expenditure Update, 2014, https://www.oecd.org/…/OECD2014-Social-Expenditure-Update-Nov2014- 8pages.pdf
Overall, Australia has a relatively low level of spending on cash benefits, but concentrates these benefits on low income groups more than any other rich country. What effect does this unusual pattern of spending have on income inequality?
Effectiveness and efficiency of social security
It is possible to measure the “effectiveness” of social security spending (or taxes) by looking at the difference between inequality in private income before benefits are received and inequality in “gross income”, after the receipt of social security benefits (with the effectiveness of taxes being measured by the difference in inequality between gross income and disposable income after taxes are paid). Effectiveness is a measure of how much the transfer system changes the distribution of incomes.
Specifically, the effectiveness of social security spending can be defined as the percentage point reduction in the Gini coefficient of income inequality associated with cash transfers. Using this approach, the Australian transfer system is the sixth most effective in the OECD at reducing inequality (Whiteford 2010), with effectiveness generally being higher in countries with higher levels of spending.
Efficiency of a social security system can be measured as effectiveness standardised by how much is spent. Using this approach, efficiency is the effectiveness measure (multiplied by 100) divided by the share in household disposable income of cash transfers (Beckerman, 1979).
Figure 3: Efficiency of social security transfers in reducing income inequality in OECD countries, 2005
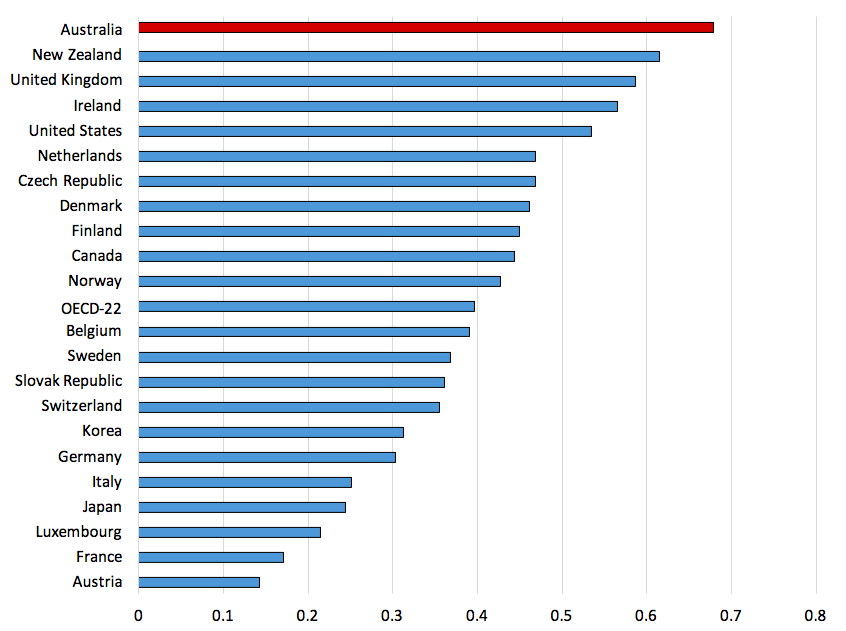
Source: Whiteford (2010), derived from OECD Income Distribution database.
Figure 3 shows a calculation of the Beckerman efficiency index for OECD countries around 2005. For example, in Australia for each 1 percentage point of public cash transfers (as a percentage of household disposable income in each country), market-income inequality is reduced by 0.679 percentage points. Thus, in terms of inequality reduction, Australia has the most efficient system of transfers in the OECD.
This article is based on Whiteford, P (2017): Social security and welfare spending in Australia: assessing long-term trends, TTPI Policy Brief 1/2017. Read Part 1, Part 2, Part 3 and Part 4.
References
Beckerman, W. (1979), “The Impact of Income Maintenance Payments on Poverty in Britain, 1975” Economic Journal, 1979, vol. 89, issue 354, pages 261-79.
OECD (2017), OECD Social Expenditure database, Data extracted on 30 Apr 2017 from OECD.Stat, http://stats.oecd.org/Index.aspx?DataSetCode=SOCX_DET# Paris.
OECD Social Expenditure Update, 2014, https://www.oecd.org/…/OECD2014-Social-Expenditure-Update-Nov2014- 8pages.pdf Paris.
Rawdanowicz L., Wurzel E., Christensen A. (2013) The Equity Implications of Fiscal Consolidation. OECD Economics Department Working Paper 1013. Paris: OECD. https://www.oecd.org/eco/public-finance/equityimplicationsoffiscalconsolidation.pdf
Whiteford, P. (2010), ‘The Australian tax-transfer system: architecture and outcomes‘, Economic Record, 86 (275), 528-544. Online ISSN: 1475-4932.


Recent Comments