

This post was originally published as part of the Tax and Transfer Policy Institute Policy Brief series. Read Part 1.
EMTRs applying the CCS and PIT cut for 2018-19 year
We present EMTR charts based on cameos that demonstrate the EMTRs produced by combining the CCS[1] which replaces CCB and CCR from 2 July 2018, with Stage 1 of the PIT rate cut that commences from 1 July 2018.
The charts present the EMTR calculated “per day” of work for the second earner. EMTR is measured based upon an increment of one day’s wage and incorporates net childcare costs. We calculate the average effective marginal tax rate for each daily increment of income earned, increasing from one day to five days (FTE). Another way of considering the EMTR is to identify the point in a year when the CCS stops completely; hence, it could be suggested that for the last two to three months of a year, families are ‘doing it tough’ because of childcare costs. We suggest it is more plausible in terms of work and childcare choices to present the data on a daily basis than on a marginal dollar basis.
We model two alternative child care costs. First, we model the long day childcare cap of $11.77 per hour, or $117.70 for a 10 hour day. Second, as some may be able to access childcare at a cheaper rate, we model a childcare fee of $10 per hour, or $100 for a 10 hour day. Child care fees in the major cities range from about $85 a day to more than $137 a day, so many will be paying fees in excess of the cap.
We model three different families with children. We assume work/activation requirements are satisfied.
- Family 1 has a relatively low wage for the primary earner of $52,730 (about 140% of the minimum wage), and the second earner at $44,880 (about 120% of the minimum wage).
- Family 2 has a primary earner at $87,000 (about the average full time male wage) and second earner at $70,000 (about the average full time female wage).
- We also model Family 3, a sole parent household at the two second earner wage levels.
None of these families can be considered high income; none of them have an earner in the top 10% of the distribution.
We apply Stage 1 of the tax cuts to commence in 2018 including the LMITO and raising the 37% threshold from $87,000 to $90,000. However, our modelled families will not benefit from the threshold increase, as they do not earn high enough wages. The families benefit from the LMITO, but the phase out of LMITO at 1.5% affects the EMTR over some income ranges.
We have previously modelled the effect for each day of work for an example of a second earner in a low income couple, combined with the Child Care Benefit CCB and Child Care Rebate CCR. In our previous modelling, we assumed a rather low hourly fee of $8.31 per hour for childcare and 2016 tax rate, family tax benefit and childcare settings. We found that the EMTR by day on the second earner reached 95% on Day 4 of work. The Appendix contains that chart and updates previous modelling to apply the above wages and the higher childcare fee of $11.77 for comparison with CCS and PIT rates for 2018-19.
Family 1 (Low to moderate earning family)
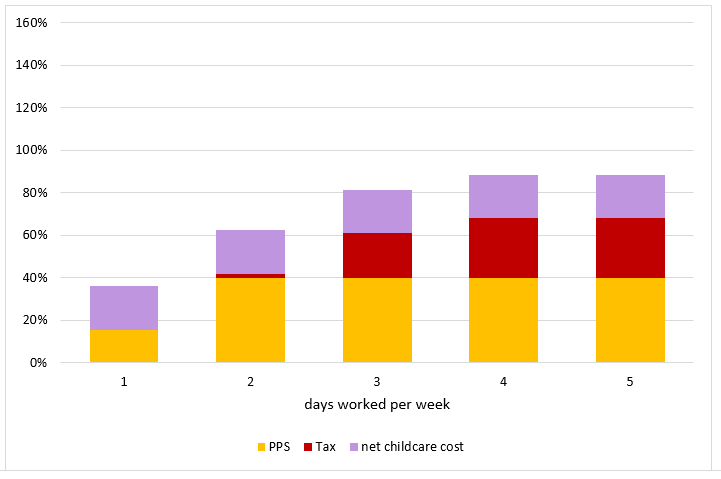
At the childcare cap of $11.77 per hour, the second earner in Family 1 faces an EMTR on Days 3 to 5 of between 85% and 95%, or an average tax rate on these three days of work of about 85%. The EMTR for Days 1 and 2 of work by the second earner is more moderate although it may be noted that this is still an average tax rate of about 50% over two days work.
Figure 3: Family 1, Childcare $11.77 per hour per child. EMTR Second earner; Primary earner $52,730, second earner $8,976 per year per day (up to $44,880); two children age 2, 3; CCS; Stage 1 tax cuts (2018)
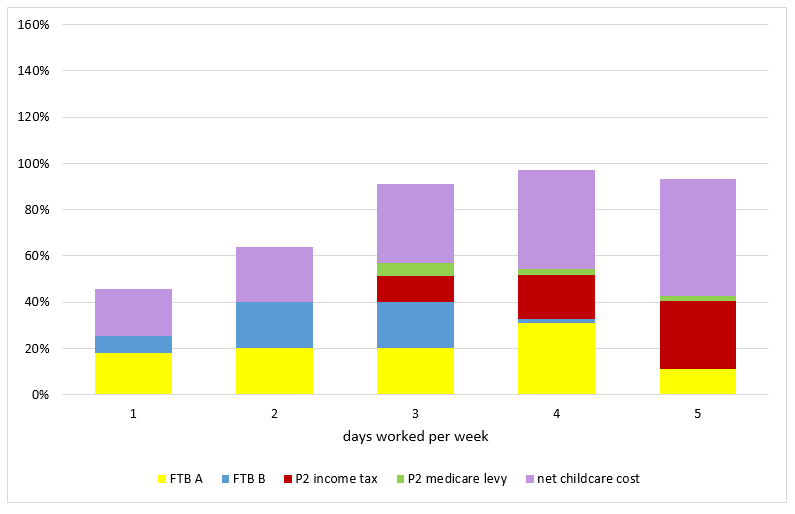
Source: Plunkett model
In dollars, this means that of the second earner’s salary of $8,976 per day per year, on each of Days 3 to 5, the second earner only retains up to about $1,300. The second earner has in total about $4,000 more income during the year, but at the cost to her (and the family) of three additional working days per week. There remains a substantial disincentive for the second earner to work more than two days a week at this wage.
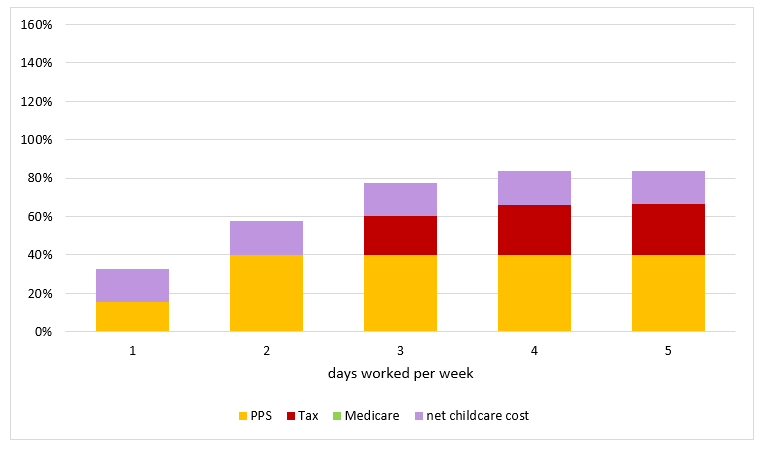
Despite continuing high EMTRs, the CCS has improved matters for this family. In the Appendix, Figure A2 presents the same scenario, applying 2016 parameters and the childcare fee of $11.77 per hour. The EMTRs under the previous regime are worse than in Figure 2, and much worse than we previously modelled at $8.31 per hour, substantially exceeding 100% on Days 3 to 5 of work.
Figure 4: Family 1, Childcare $10 per hour per child. EMTR Second earner; Primary earner $52,730, second earner $8,976 per year per day (up to $44,880); two children age 2, 3; CCS; Stage 1 tax cuts (2018)
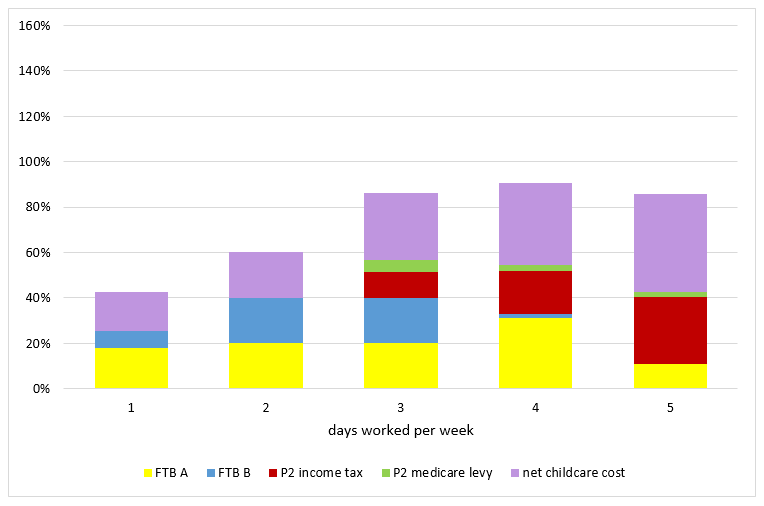
Source: Plunkett model
Family 2: Average earning family
Family 2 earns higher incomes: the primary earner earns $87,000 per year and the second earner $14,000 per day, increasing to $70,000 per year full time.
Figure 5 shows that the EMTRs for working from one to three days a week range from 45% to 65% for the second earner. The EMTRs for Days 4 and 5 of work are lower than for Family 1, but still high at just over 80%. Therefore, in spite of the higher wages of both primary and second earner in this family, there remains only limited additional income of about $5,500 per year to be gained at a cost of three additional days of work per week. This EMTR is caused primarily by the withdrawal of CCS on joint income.
Figure 5: Family 2. childcare $11.77 per hour per child. EMTR Second earner; Primary earner $87,000, second earner $14,000 per year per day (up to $70,000); two children age 2, 3; CCS; Stage 1 tax cuts (2018)
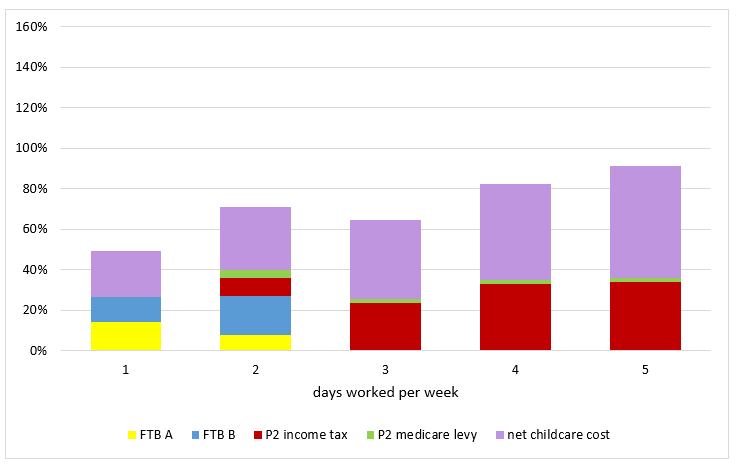 Source: D Plunkett model
Figure 6 shows the EMTR at a lower childcare cost of $10 per hour. The EMTRs are substantially better for up to 3 days of work, and marginally better on Day 4 of work. That is, if both earners can derive average wages and the family can access relatively cheap childcare, they will be substantially better off from up to 4 days work by the second earner. However, the EMTR on Day 5 of work by the second earner is about 90%. Over the full week of work by the second earner, the effective average tax rate is about 70%, nearly three times the average tax rate of about 25% faced by an individual without children earning $70,000 (as shown in Figure 1).
Figure 6: Family 2. childcare $10 per hour per child. EMTR Second earner; Primary earner $87,000, second earner $14,000 per year per day (up to $70,000); two children age 2, 3; CCS; Stage 1 tax cuts (2018)
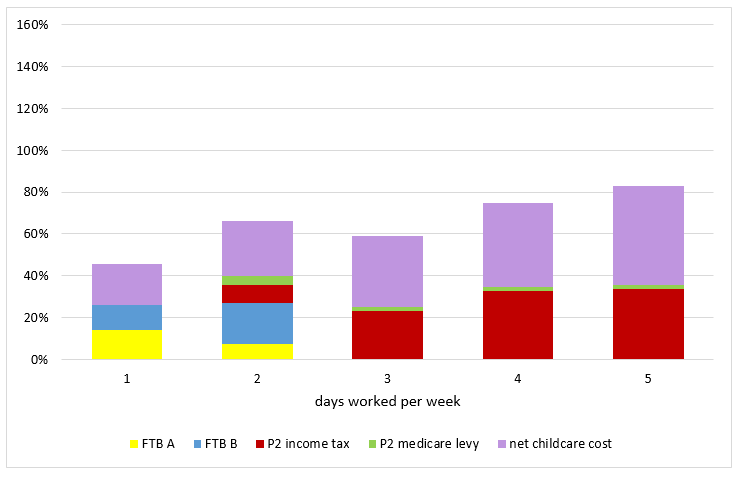
Source: D Plunkett model
Family 3: Sole parent
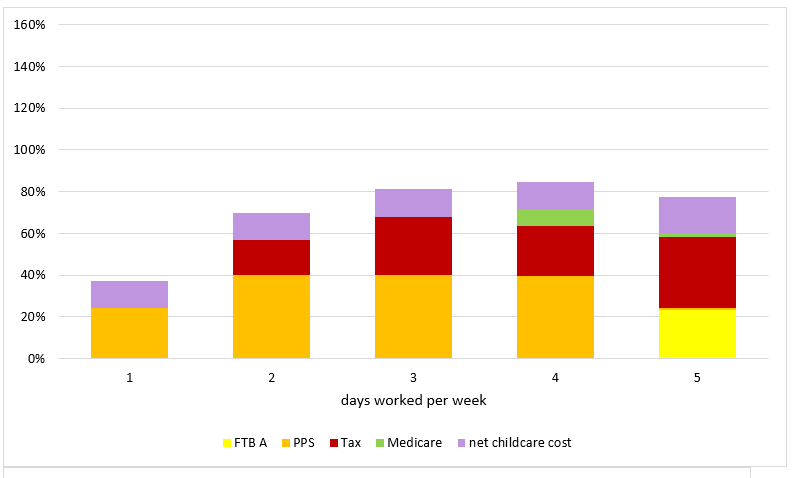
We also model these settings (at the second earner wage) for a sole parent. Figures 7 to 9 show that a sole parent earning a higher wage derives more income by being in full time work than not; however, the EMTR exceeds 80% on Days 3 to 5 of work and the lower childcare fee makes little difference.
Overall, it pays to work for sole parents, although at this wage, the benefit from moving from part-time to full-time work is small at the cost of more days of work. Some sole parents will benefit from a higher CCS which covers 95% of the childcare fee, or even more if they satisfy more stringent work or study requirements. We do not address that special case in our cameo.
Figure 7: EMTR Sole parent, childcare $11.77 per hour per child; $8,976 per year per day (up to $44,880); two children age 2, 3; CCS; Stage 1 tax cuts (2018)
 Source: Plunkett model.
Figure 8: EMTR Sole parent, childcare $10 per hour per child; $8,976 per year per day (up to $44,880); two children age 2, 3; CCS; Stage 1 tax cuts (2018)
 Source: D Plunkett model
Figure 9: EMTR Sole parent; $14,000 per year per day (up to $70,000); two children age 2, 3; childcare $11.77 per hour per child (CCS; Stage 1 tax cuts) (2018)
 Source: Plunkett model.
Still a way to go to remove high EMTRs on women’s work
Women’s workforce participation rates have increased markedly since the 1970s, but this increase has been concentrated almost entirely in part-time work. The greatest dip in female workforce participation occurs when a household is caring for one or more children under the age of five. There are cultural and social reasons for this, but there are also economic reasons: it is a rational response to high EMTRs applicable to workers with elastic labour supply.
The new CCS improves EMTRs for second earners in our cameos compared to CCB and CCR. However, only a small benefit is provided by the Stage 1 LMITO and the personal tax cuts make little impact on these high EMTRs. Despite improvements, in the new regime, second earners, mostly women, as well as sole parents, still face high EMTRs on moving from part-time to full time work. In many cases, family incomes increase by a relatively small amount at the cost of several additional days of work.
The daily EMTRs second earners face are significantly higher than the marginal rates faced by higher earning full time workers – including those at the threshold of $90,000 which is enacted for the 37% tax rate. The main cause is the income-tested withdrawal of family tax benefit and CCS based on joint family income. The second earner’s salary is piled “on top” of the primary earner’s income, leading to the phase out of these benefits at about the level of income when the second earner would increase her days worked from part time to full time.
Families avoid the effect of these EMTRs in several ways. Women, and/or couples jointly, decide that it is not financially worthwhile to work full-time and specialise in looking after children. In most families, it is still the mother who reduces her work hours to do childcare in the home. As many as 30% of families access grandparental or other informal care at least one day a week.[2] If the childcare cost can be eliminated for a day, then the choice to increase paid work hours looks significantly more attractive. But many families do not have access to informal care for various reasons; nor is it always a sustainable option for families.
Some families obtain cheaper care. Family day care, and some childcare centres, have lower fees than the cap of $11.77 that we model. A lower cost of care net of the subsidy will produce lower EMTRs. However, cheaper care is not always available and it may not be desirable to push for cheaper child care as child care workers are already paid relatively low wages. The quality of care is important to Australian families and many invest in more expensive care than the government cap.
The combination of traditional gender roles and high marginal tax rates on second earners produces unequal outcomes for men and women. Over the lifecourse, “specialising as the primary caregiver has a high personal economic cost to women, but it also has a large societal cost, in terms of foregone productivity and higher income support dependency rates.”[3] At a fiscal cost over four years for Stage 1 only of $13.4 billion, the PIT rate cuts dwarf the fiscal cost of about $3 billion of expanding childcare support, but do not remove the disincentive to engage in paid work for many women. An important reform agenda is making sure that the tax system does not discourage anyone who wants to work from working – in particular, by expanding child care – to benefit women and men more equally while also achieving economic goals.
[1] Australian Government, Fact sheet https://docs.education.gov.au/node/38911;
[2] Australian Institute of Family Studies (2015) https://aifs.gov.au/publications/child-care-and-early-childhood-education-australia
[3] Kalb G (2017)
References
Australian Bureau of Statistics (ABS) (2017) 4125.0 – Gender Indicators, Australia, Sep 2017 http://www.abs.gov.au/ausstats/[email protected]/Lookup/by%20Subject/4125.0~Sep%202017~Main%20Features~Economic%20Security~4
Australian Government Department of Education and Training, Child Care Subsidy – Combined Family Income https://www.education.gov.au/child-care-subsidy-combined-family-income-0 (viewed 8 August 2018).
Australian Government Department of Education and Training, Fact Sheet, New Child Care Package Overview https://docs.education.gov.au/node/38911 (viewed 8 August 2018)
Baxter, J (2015) Childcare and early childhood education in Australia https://aifs.gov.au/publications/child-care-and-early-childhood-education-australia (Australian Institute of Family Studies).
Breunig, B and Gong, X (2017) ‘Childcare Assistance: Are Subsidies or Tax Credits Better?’ FISCAL STUDIES, vol. 38, no. 1, pp. 7–48 (2017) 0143-5671
Ingles, D and Plunkett, D (2016) Policy Brief: Effective Marginal Tax Rates https://taxpolicy.crawford.anu.edu.au/publication/12578/effective-marginal-tax-rates;
Kalb, G (2017) ‘Taxes, transfers, family policies and paid work over the female life cycle’, Chapter 5 in Stewart M (ed) (2017) Tax, Social Policy and Gender (ANU Press), https://press.anu.edu.au/node/3959/download
World Economic Forum (2016), Autralia http://reports.weforum.org/global-gender-gap-report-2016/economies/#economy=AUS
Parliamentary Budget Office (PBO) (2018), Partial response 1 of 2 (5 June), https://www.aph.gov.au/About_Parliament/Parliamentary_Departments/Parliamentary_Budget_Office/Publications/subs
Parliamentary Budget Office (PBO) (2018), Partial response 2 of 2 (13 June), https://www.aph.gov.au/About_Parliament/Parliamentary_Departments/Parliamentary_Budget_Office/Publications/subs
Stewart, M (2017) ‘Gender inequality in Australia’s tax-transfer system’ (ed) Tax, Social Policy and Gender: Rethinking Equality and Efficiency (ANU Press: Canberra) 1-32.
Stewart, M, Voitchovsky, S and Wilkins, R (2017) ‘Women and top incomes in Australia’ in Stewart, M (ed) Tax, Social Policy and Gender: Rethinking Equality and Efficiency (ANU Press: Canberra).


Recent Comments