

This post was originally published as part of the Tax and Transfer Policy Institute Policy Brief series. Read Part 2.
Introduction
In Australia’s tax and social welfare system, many women face effective marginal tax rates (EMTRs) on work income which are higher than the marginal tax rates of the personal income tax structure. Even for some top income earners, high EMTRS may be produced.[1] For example, if those caring for young children (mostly women) return to work or increase their work hours, this simultaneously requires them to pay increased taxes (and, possibly, the Medicare Levy) at the same time that family payments and child care subsidies are phased out. These high EMTRs tend to affect women more than men because women tend to be secondary earners in families either in terms of lower wages or lower working hours.
The Government’s new Child Care Subsidy (CCS) and the recently enacted personal income tax (PIT) rate cuts might alleviate this effect for some families, by increasing the amount of the subsidy and reducing the phase out, and by lowering the personal income tax payable on earnings. This short paper explores whether stage 1 of the PIT rate cuts, combined with the CCS, will alleviate high EMTRs that are disincentives to women increasing workforce participation.
We explore some of the effects of the new CCS and PIT rate cuts through cameos of some families. We present charts of the EMTR per day of work, for three examples of moderate earning families. We find that the CCS expansion has had some effect in improving dramatically high EMTRs under the previous regime. However, we find that high EMTRs still result for increasing hours from part-time to full-time work. The PIT rate cut does little to change this effect. High EMTRs, the cost of child care and women bearing the bulk of care responsibilities remain barriers to increasing work hours for women.
Child Care Subsidy
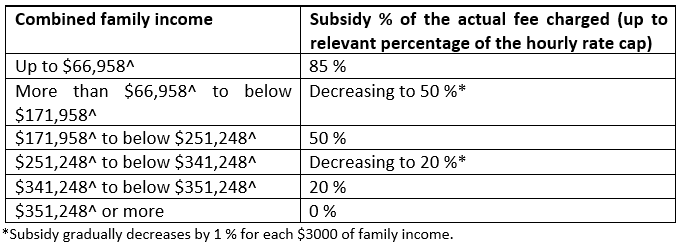
The CCS replaced Child Care Benefit (CCB) and Child Care Rebate (CCR) from 2 July 2018. The expansion of the subsidy has been estimated to cost about $3 billion over 4 years from the 2017-18 budget that introduced the changes. It raises the amount of subsidy per child up to a cap and changes the design of the taper, or phase out, of CCS. The phase out continues to be based on joint family income.
Table 1: CCS[2]
The Personal Income Tax rate cuts
The PIT rate cuts, now enacted,[3] will apply in three stages. In Stage 1 commencing on 1 July 2018, the Bill applies the following components:
- Low and Middle Income Tax Offset (LMITO) of up to $530 for individuals with taxable income up to $125,333 for the 2018-19, 2019-20, 2020-21 and 2021-22 financial years.
- Increase the upper threshold for the 32.5 % marginal tax rate (where the 37 % rate commences) from $87,000 to $90,000.
In Stage 2 commencing on 1 July 2022 the Bill applies the following components:
- Increase the upper threshold for the 32.5 % marginal tax rate (where the 37 % marginal rate commences) from $90,000 to $120,000.
- Increase the upper threshold for the 19 % marginal tax rate (where the 32.5 % rate commences) from $37,000 to $41,000.
- Repeal the LMITO and Increase the Low Income Tax Offset to up to $645 for taxable incomes up to $66,667.
In Stage 3, commencing on 1 July 2024, the Bill applies the following components:
- Increase the lower threshold for the 45 % marginal tax rate from $180,001 to $200,001.
- Remove the 37 % marginal tax rate, so that all income from $41,001 to $200,000 is taxed at a marginal rate of 32.5 %.
The effective PIT rate structure produced by Stage 1 is set out in Table 2:
Table 2: 2018-19 Personal Income Tax Scale
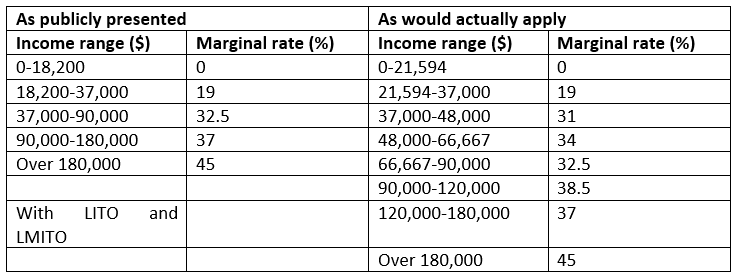
Note: In addition, the Medicare Levy of 2 per cent is phased in over a small range by family income.
Source: Andrew Podger http://www.austaxpolicy.com/budget-forum-2018-not-genuine-equitable-way-simplify-personal-income-tax-system/
The effective tax rate structure (ignoring the transfer system) applicable for the 2018-19 year is shown in Figure 1.
Figure 1: Tax rate structure (Stage 1 2018-19 settings)

Source: Chart prepared by Kristen Sobeck based on TTPI calculations.
Some context: Gender effects of the tax cuts
Distributional analysis of the tax cuts by the Parliamentary Budget Office (PBO) demonstrates that overall, the tax cuts will benefit men significantly more than women, in each Stage, over 4 years and over 10 years.[4] This is unsurprising. ATO individual tax records data reveals very significant gender inequality in income, especially at the top of the income distribution (Table 3).
Table 3: Share at the top of the Income distribution (2013-14), male and female
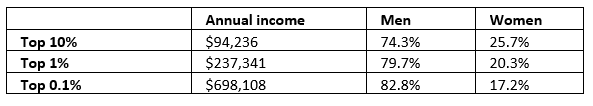
Source: ATO individual tax records data; Stewart, Voitchovsky, Wilkins (2017).[5] Excludes capital gains and franking credits.
The LMITO will benefit some high income earners in the top 10% as it is phased out at $125,333. The phase out at 1.5 cents in the dollar produces a small increase in EMTRs over the phase out range.
Overall, the tax cuts benefit higher income earners (who pay more tax) the most, who are predominantly men. Of course, the tax law does not have “pink forms and blue forms”, as Treasurer Scott Morrison remarked. Substantive earnings inequalities between men and women persist due to differences in work participation and differences in average wages. These differences reflect differences in observable and unobservable worker characteristics and any occupational segregation or wage discrimination.[6]
The fiscal cost by gender of Stage 1 of the tax cuts is estimated by the PBO over 4 years at $7.28 billion for men and $6.12 billion for women. The PBO estimates that 5,146,000 men and 4,863,000 women will benefit from LMITO in the 2018-19 year.[7] This suggests that men and women benefit close to equally from the LMITO overall both in raw numbers and in dollars.
However, more than twice the number of men as women benefit from the increase to the threshold for the 37% marginal tax rate from $87,000 to $90,000. The PBO estimates that 2,168,000 men and 960,000 women benefit from this change in 2018-19. Again, this is not surprising; as Table 3 shows, less than one third of those who earn above that threshold are women. These fiscal estimates are presented in Table 4.
Table 4: Stage 1 Tax Cuts 4 year and 10 year estimate: male, female and total fiscal cost
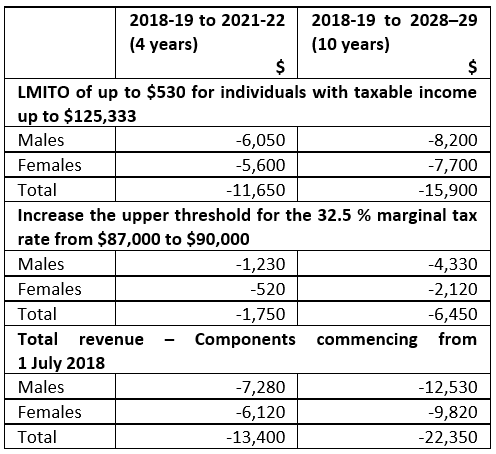
Source: Extracted from Table A1, PBO (2018)[8]
Effective marginal tax rates and workforce participation
Female workforce participation is increasing, but working age women still participate 10 percentage points less than men in the paid workforce. The ABS Gender Indicators show that 45% of women employed were part-time in 2016-17. For men, it’s only 16%. The gender disparity for those caring for children is most stark: the proportion of women caring for a child under 5, working part time is 61%, while for men this proportion is 8.4%.
Relying on slightly different measures, the OECD statistics indicate that Australia has one of the highest rates of female part time employment in the OECD (under 30 hours a week).
Figure 2: Part-time employment rate for women as % of employment (2017 or latest data, OECD)

Source: OECD data (2017 or latest data, selected countries highlighted).
The empirical evidence suggests that women caring for younger children have a more elastic labour supply, so are more likely to be deterred from increasing work hours as a result of high EMTRs.[9] A woman who is caring for one or more young children in a couple is more likely than not to be the ‘second earner’, with a lower wage and/or a more flexible job than the primary earner. This means that her workforce decision is the marginal decision in the household. The ‘primary earner’, almost always the man, will continue working full-time. Families make choices about what is best for household well-being including income and care of children; however, it is not clear whether families, or women themselves, take into account the long-term costs and benefits of the decision about work for women.
[1] For example, as a result of the reduction in the superannuation contributions tax concession by Div 293 of the Income Tax Assessment Act 1997 raising the contributions tax from 15% to 30% when income reaches $250,000 – this pushes up the top rate from 47% to 62% at that threshold.
[2] Australian Government (2018) https://www.education.gov.au/child-care-subsidy-combined-family-income-0
[3] Treasury Laws Amendment (Personal Income Tax Plan) Act 2018 (Cth).
[4] PBO, Partial response 1 of 2 (5 June 2018), https://www.aph.gov.au/About_Parliament/Parliamentary_Departments/Parliamentary_Budget_Office/Publications/subs
[5] http://press-files.anu.edu.au/downloads/press/n3959/pdf/ch09.pdf
[6] World Economic Forum (2016), http://reports.weforum.org/global-gender-gap-report-2016/economies/#economy=AUS
[7] PBO, Partial response 2 of 2 (13 June 2018), https://www.aph.gov.au/About_Parliament/Parliamentary_Departments/Parliamentary_Budget_Office/Publications/subs
[8] PBO, Partial response 1 of 2 (5 June 2018), https://www.aph.gov.au/About_Parliament/Parliamentary_Departments/Parliamentary_Budget_Office/Publications/subs
[9] See the discussion of labour supply elasticities in Ingles, D and Plunkett, D (2016); Kalb G (2017) Table 5.1 and Breunig, B and Gong, X (2017).
References
Australian Bureau of Statistics (ABS) (2017) 4125.0 – Gender Indicators, Australia, Sep 2017 http://www.abs.gov.au/ausstats/[email protected]/Lookup/by%20Subject/4125.0~Sep%202017~Main%20Features~Economic%20Security~4
Australian Government Department of Education and Training, Child Care Subsidy – Combined Family Income https://www.education.gov.au/child-care-subsidy-combined-family-income-0 (viewed 8 August 2018).
Australian Government Department of Education and Training, Fact Sheet, New Child Care Package Overview https://docs.education.gov.au/node/38911 (viewed 8 August 2018)
Baxter, J (2015) Childcare and early childhood education in Australia https://aifs.gov.au/publications/child-care-and-early-childhood-education-australia (Australian Institute of Family Studies).
Breunig, B and Gong, X (2017) ‘Childcare Assistance: Are Subsidies or Tax Credits Better?’ FISCAL STUDIES, vol. 38, no. 1, pp. 7–48 (2017) 0143-5671
Ingles, D and Plunkett, D (2016) Policy Brief: Effective Marginal Tax Rates https://taxpolicy.crawford.anu.edu.au/publication/12578/effective-marginal-tax-rates;
Kalb, G (2017) ‘Taxes, transfers, family policies and paid work over the female life cycle’, Chapter 5 in Stewart M (ed) (2017) Tax, Social Policy and Gender (ANU Press), https://press.anu.edu.au/node/3959/download
World Economic Forum (2016), Autralia http://reports.weforum.org/global-gender-gap-report-2016/economies/#economy=AUS
Parliamentary Budget Office (PBO) (2018), Partial response 1 of 2 (5 June), https://www.aph.gov.au/About_Parliament/Parliamentary_Departments/Parliamentary_Budget_Office/Publications/subs
Parliamentary Budget Office (PBO) (2018), Partial response 2 of 2 (13 June), https://www.aph.gov.au/About_Parliament/Parliamentary_Departments/Parliamentary_Budget_Office/Publications/subs
Stewart, M (2017) ‘Gender inequality in Australia’s tax-transfer system’ (ed) Tax, Social Policy and Gender: Rethinking Equality and Efficiency (ANU Press: Canberra) 1-32.
Stewart, M, Voitchovsky, S and Wilkins, R (2017) ‘Women and top incomes in Australia’ in Stewart, M (ed) Tax, Social Policy and Gender: Rethinking Equality and Efficiency (ANU Press: Canberra).


Recent Comments