

The discussion in the first part of this series – like most analyses of social expenditure – is based on gross (before tax) public expenditure data – how much the government spends. In Is the American Welfare State Unusually Small? political scientist Christopher Howard pointed out that ‘The prevailing wisdom is easy to summarize. The size of welfare states is measured in the literature by the share of gross domestic product (GDP) devoted to public social spending, which is sometimes referred to as a nation’s ‘welfare state effort’. This approach can lead to arguments that ‘bigger is better’ for those favouring welfare state interventions, or that ‘smaller is better’ for those wanting to shrink the volume of public spending.
The level of spending in different countries and at different times varies for a range of reasons. Countries with a higher share of the population at older ages will tend to spend more on pensions, aged care and health care, while countries with a higher share of children are likely to spend more on child care, education and family benefits, other things being equal. Spending on older people tends to be much higher than spending on children, so population ageing puts upward pressure on public spending.
In periods of high unemployment, countries will spend more on benefits for the unemployed. It could also be expected that countries with more unequal distributions of income from the labour market and higher levels of poverty will need to spend more to reduce poverty and inequality – although whether they do so or not will reflect political choices.
In addition, the level of spending – and whether bigger or smaller is better – will be the result of choices made about the design of the social security system, the way it is funded, and the interactions between the spending side (transfers) and the funding side (taxes). These can also reflect choices made decades before when social programmes were originally introduced.
As Christopher Howard and others, notably, Adrian Sinfield point out, it has long been recognized that the objectives of the welfare state can be achieved through a range of different instruments. In 1956, Richard Titmuss referred to the ‘social division of welfare’, as including three main means of provision: social welfare (the social services including cash benefits discussed earlier); fiscal welfare (welfare distributed directly or indirectly through the tax system); and occupational welfare (welfare provided as part of employment).
The main underlying idea was to look beyond conventional definitions of the welfare state, to identify the different patterns of redistribution provided through alternative mechanisms, and to explain that different kinds of programmes can have similar effects in some cases, or offsetting effects in others.
For example, through the tax system, governments can: (1) claw back financial support through direct and indirect taxation of benefit income; (2) directly provide support to households (e.g. child tax credits); or (3) encourage individuals and companies to provide social support (e.g. through favourable tax treatment of private pension contributions and earnings or private health insurance coverage).
Tax clawbacks can take the form of provisions like the high income tax clawback on Child Benefit mentioned in the previous post. More commonly, in social insurance systems that replace high proportions of previous income it is common for benefits to be taxed in the same way as ordinary income. In contrast, in countries where benefits are intended to alleviate poverty and are flat-rate and means-tested, taxation of poverty-level payments makes little sense. Countries with more generous benefits also tend to have higher levels of indirect taxes, such as VAT, which also claw-back social spending.
The conventional emphasis on direct public spending also ignores other forms of public intervention, for example, when governments mandate employers to provide pension coverage or sickness insurance, or when governments regulate the conditions of private health insurance coverage (for example, by forbidding risk‐related premiums and thus requiring pooling of risks). Furthermore, the private sector including individuals can also provide social benefits voluntarily which top‐up government regulated provisions.
Overall, a comprehensive assessment of total welfare provisions means that it is necessary to capture the additions to and subtractions from public spending that are made through the tax system, as well as the additional support provided through mandatory private social spending. This approach is far more comprehensive.
Since the late 1990s, the OECD has analysed both the role of private social benefits and the impact of the tax system on social spending, with regular publications since then (including a chapter in the Oxford Handbook of the Welfare State by Willem Adema and myself), and the most recent data also referring to 2017.
This expanded analysis enables a more complete picture of the size of the welfare state and how the United Kingdom compares. Chart 1 shows OECD estimates of the extent of spending clawed back in these different ways.
Chart 1: Estimated clawback of social spending through direct and indirect taxes (% of GDP), OECD countries, 2017
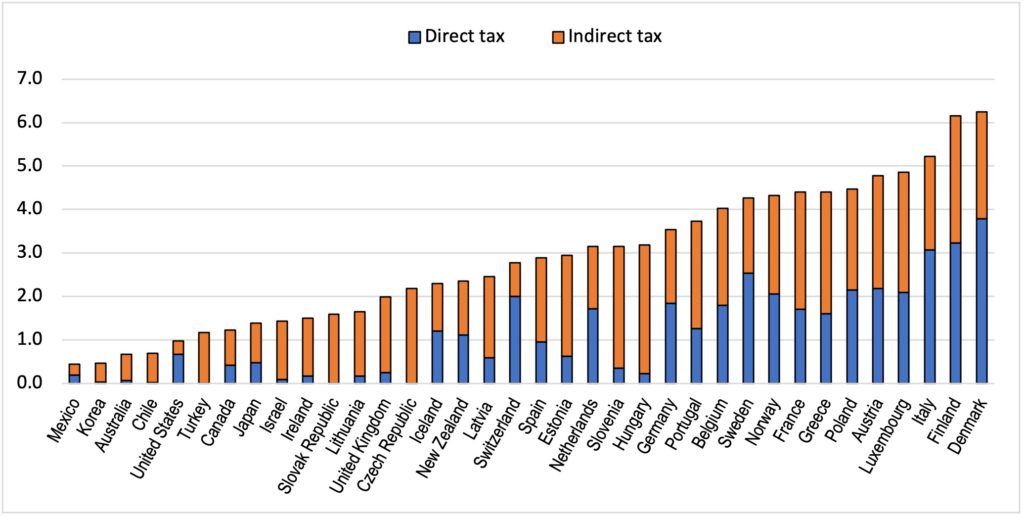
Source: OECD, Social Expenditure Update (2020), https://www.oecd.org/social/expenditure.htm
From Chart 1, it can be seen that the level of spending clawed back through direct and indirect taxes was less than 1% of GDP in countries such as Mexico, Korea, Australia, Chile and the United States, while in Finland and Denmark it was more than 6% of GDP. In the United Kingdom, the clawback amounted to around 2% of GDP, placing it in the lower third of countries on this metric. It is also notable that nearly all of this clawback in the United Kingdom is through indirect taxes such as VAT – although the effect of this is at the OECD average. Taking account of these tax clawbacks narrows the differences between countries, as many of those with high levels of spending immediately tax it back, while countries with low levels of spending tend not to. While the difference between countries is narrowed, this adjustment does not substantially change the ranking of the United Kingdom.
Chart 2 shows estimates of mandatory and voluntary private social spending. Mandatory private social expenditure is social support stipulated by legislation but operated through the private sector, for example, direct sickness payments by employers to absent employees, or benefits accruing from compulsory contributions to private insurance funds. Voluntary private social expenditure includes benefits accruing from privately operated programmes that involve the redistribution of resources across households and include benefits provided by NGOs, and benefit accruing from tax advantaged individual plans and collective (often employment-related) support arrangements, such as for example, pensions, childcare support, and, in the US, employment-related health plans.
Mandatory private spending is virtually non-existent in most OECD countries, but exceeds 5% of GDP in Australia, Iceland, the United States and the Netherlands and more than 10% of GDP in Switzerland. At 0.9% of GDP in the United Kingdom it is below the very skewed OECD average.
Chart 2: Mandatory and voluntary private social spending (% of GDP), OECD countries, 2017
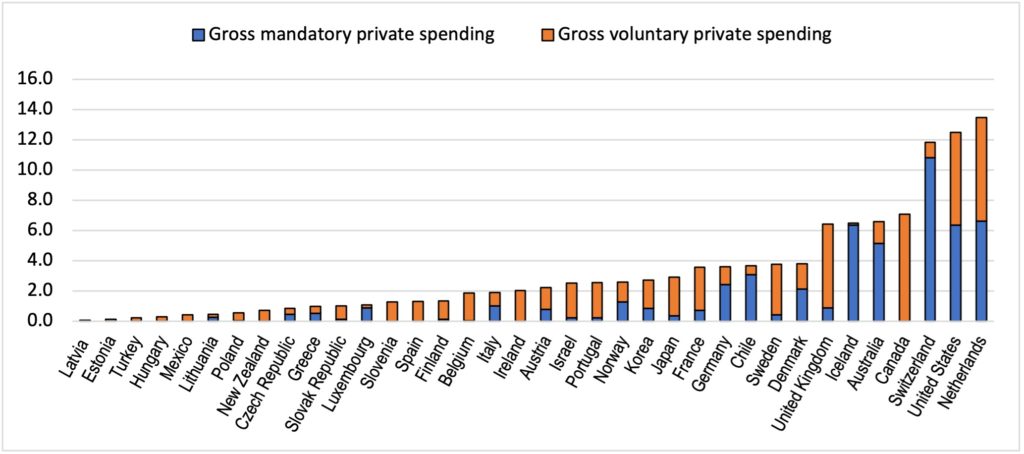
Source: OECD, Social Expenditure Update (2020), https://www.oecd.org/social/expenditure.htm
Voluntary private spending in the United Kingdom is the 4th highest in the OECD, after Canada, the United States and the Netherlands, with this mainly relating to private or occupational pensions. Private pension provision can be an important part of national social protection systems and supplements other sources of retirement incomes, but it mainly benefits higher income groups.
In addition, many countries have extensive tax concessions for private pension provision, which generally favour higher-income groups in retirement, sometimes very substantially. The OECD Social Expenditure database does not include these in the calculations described above, because the value of these tax concessions should be measured over the lifetime, while the social expenditure data describe annual spending and taxing. (However, there are separate OECD publications that detail the taxation concessions for private pensions.)
In summary, the overall effect of taking account of these interactions with the tax system does not change the ranking of the United Kingdom to a significant extent, although it does provide a more comprehensive picture of welfare state effort.
Adding private social expenditure would have a significant impact for the United Kingdom, adding 5.6% of GDP to gross spending. While it is important to understand these impacts on household resources, private social spending differs fundamentally in its objectives and impact from public spending. The fact that private pensions are substantial in the United Kingdom clearly does not mean that social security spending for people of working age is any more adequate as a result.
How is spending distributed by income groups?
As mentioned earlier, these interactions with the tax system and private provision also reflect the objectives of different social security systems and the ways they have been designed. Two of the most important design features relate to the ways benefits are funded and structured – i.e. the relationship between benefits received and the past or current income of beneficiaries.
Using these criteria, social security systems in OECD countries are often characterised as either “Bismarckian” or “Beveridgean”. Bismarckian programmes are based on social insurance principles, with earnings-related benefits, entitlements based on contribution records and funding through employer and employee contributions. Beveridgean policies are characterised by universal provision, with entitlement based on residence or need, and with flat-rate benefits financed through general taxation.
A related way of classifying welfare state arrangements is on the basis of the forms of redistribution emphasised in different institutional arrangements. Rather than focusing on the early architects of the welfare state this classification looks to the architecture itself. Nick Barr of the London School of Economics points out that the main objective of transfer systems in most countries is to provide insurance against adverse risks (unemployment, disability, sickness) and to redistribute across the lifecycle, either to periods when individuals have greater needs (for example, when there are children in the household) or would otherwise have lower incomes (such as in retirement). Barr describes this as the “piggy-bank objective”.
The second main objective of the welfare state can be described as “taking from the rich to give to the poor” (which Barr calls the “Robin Hood” motive). Targeting of benefits is usually justified as a means of achieving the “Robin Hood” objective. Bismarckian welfare states give priority to the “piggy-bank” objective, while Beveridgean welfare states give priority to the “Robin Hood” objective.
The Robin Hood approach is usually associated with income-tested systems. Australia is the strongest example of a country emphasising the “Robin Hood” approach since it no longer has any free-of-income test social security payments, not even its Age Pension. For working-age payments, a significant number of countries – including the United Kingdom – target payments to lower income groups in a variety of ways.
Chart 3 shows the share of cash benefits received by different income groups among the working-age population. These estimates are derived by the OECD from the OECD Income Distribution database, which brings together as far as possible comparable measures of the distribution of income across OECD countries (in Excel spreadsheets that are publicly available for download).
Chart 3: Share of public cash transfers received by working-age individuals in low and high-income groups, in 2016
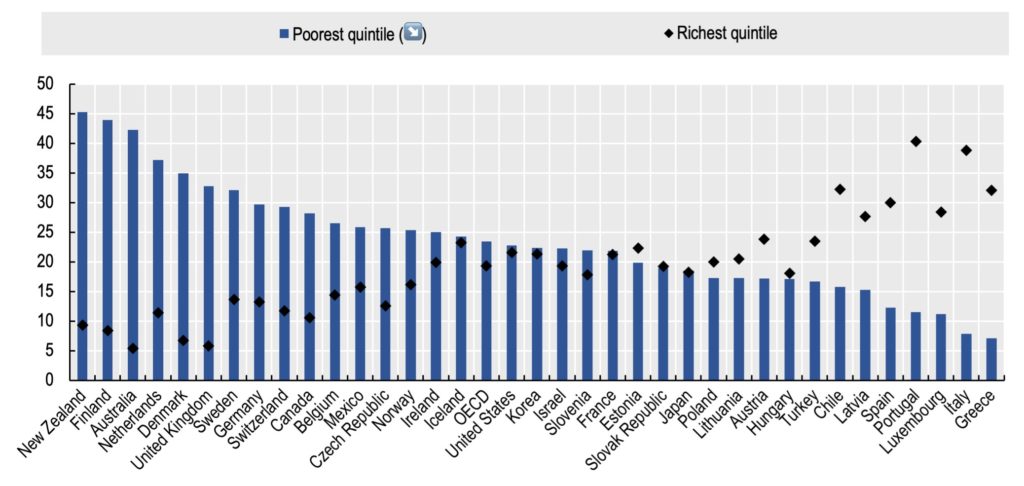
Note: Data refer to 2016 for all countries except Chile, Denmark, Germany, Iceland, Ireland, Japan, Korea, Switzerland, Turkey (2015); Hungary, Mexico and New Zealand (2014). Source: Calculations based on OECD Income Distribution Database. Society at a Glance 2019 – © OECD 2019
Chart 3 shows that nearly one-third of all social security spending for working-age households in the United Kingdom goes to the poorest 20% of households (while the richest 20% receive about 6% of total spending). In New Zealand it is as high as 45%, while the OECD average is about half of this (23.4%), with the United States being just below average. In 15 OECD countries the poorest 20% by income get less than 20% of the spending, which reflects the design of their systems and the size of the formal labour market (how many people contribute to social security and therefore benefit from it.)
So, the United Kingdom ranks 6th highest in the OECD in terms of the share of spending on working-age payments that goes to the poor. Does this make the system “more generous” than it appears from the gross spending levels?
To some extent, yes. Countries where low-income groups receive a “disproportionate” share of spending could be expected to be more “target efficient” in reducing inequality and poverty. For every pound they spend, more goes to the poor.
But their effectiveness in reducing inequality will also depend on how much they spend in total. Targeting the poor may reduce support for higher spending and more generous benefits, an issue extensively discussed in the social policy literature (e.g. Walter Korpi and Joachim Palme) as well as in the context of lower-income countries (e.g. does more for the poor mean less for the poor?).
It is also notable that a number of countries where spending is much higher than the United Kingdom, including Finland, the Netherlands and Denmark, actually target the poor more than the UK, while Sweden and Germany are only just below the UK share
In summary, spending on working-age payments in the United Kingdom is not high by comparisons with other OECD countries. The lower level of taxation of benefits and the higher degree of targeting lower income groups is likely to mean that the UK might be more highly ranked if the focus is net assistance for lower-income groups.
To see whether this is in fact the case, the next post in this series will move from these overall spending measures to look at data on actual entitlements for individuals and households. Fortunately, the OECD also provide comprehensive figures on these measures – the Benefits and Wages database.
First published at the IPR Blog on Wednesday 2 November 2022. The IPR Blog is run by the University of Bath Institute for Policy Research (IPR). Read Part 1 and Part 3.


Peter,
When you say “taxation of poverty-level payments makes little sense”, you’re forgetting your Asprey (Report 1975, which recommended making income support taxable, so as to enable partial ‘claw-back’ via the personal income tax system of the fiscal cost of providing income support in part-year cases, which helps keep our income support system fiscally sustainable). Still in place – & still works more-or-less as intended – today!