

The first post in this series looked at how much the UK government spends on social security and welfare, with a focus on assistance for people of working-age. This showed that overall spending on working-age payments in the United Kingdom is not high by comparisons with other OECD countries, with the UK ranking 27th out of 38 countries. A more detailed dive into the numbers shows that spending on children and on support with housing costs is near the top of the OECD rankings, but that spending on the unemployed was very far below average, with the UK at 33rd out of 36 OECD countries for which data were available.
The second part of this series looked at the social division of welfare, in particular how the tax system is used to either claw-back social spending or augment it, and the role of private and occupational social spending. It also discussed how much spending was directed to lower-income groups. This discussion suggested that the lower level of taxation of benefits in Britain and the higher degree of targeting towards lower income groups is likely to mean that levels of spending, even if adjusted to take account of interactions with the tax system and what share of spending is directed to low-income groups, only provides a broad picture of welfare state generosity. What actually happens at the household or individual level?
A common method to assessing the level of benefits is to calculate what people are entitled to under the rules of different social security systems, using what is called the ‘model family approach’.
This approach involves identifying specific household types – singles by their age, lone parents by the number and age of children, couples with and without children – and calculating what their benefit entitlements are based on the rules of the system in their country or specific location (different States in the USA or municipalities in some European countries).
There are a range of different sources of these types of data, with the first analysis of minimum income benefits for all OECD countries in 1992 being undertaken by researchers at the University of York and published by the Department of Work and Pensions in 1996. Since then, there have been related studies and databases developed at the University of Antwerp and the University of Stockholm.
The most comprehensive source is the OECD Benefits and Wages database which ‘includes detailed descriptions of tax and benefit rules in OECD and EU countries as they apply to working-age families …and enables international comparisons of how tax liabilities and benefit entitlements affect the disposable incomes of families in different labour-market circumstances’.
The database contains estimates of disposable incomes of different household types for each year since 2001, expressed as ‘net replacement rates’ for the unemployed (what % of an individual’s previous net earnings they receive if they become unemployed), and also the level of minimum income payments as a percentage of median household income (adjusted for household size) in each country for which these data are available. There is also an online calculator which allows users to estimate disposable incomes and their components using varying assumptions about the type of household, previous earnings level, length of unemployment and contribution history, amongst other policy variables.
Chart 1 shows one of the simplest measures of comparative benefit generosity, which is the net replacement rate for an unemployed single person aged 40 in 2019 in the second month of unemployment. I have chosen 2019 for this comparison as a number of countries introduced increases in assistance in the Covid pandemic from 2020, but many of these changes were temporary. In this sense, 2019 was a “normal” year. (The next post in this series will look at some of the changes in benefit systems during the pandemic period.)
Chart 1 shows that in 2019 a single person in the UK had the lowest net replacement rate in the OECD, with someone who had previously worked at the average wage receiving just 12% of their previous disposable income compared to an OECD average of 55%.
Other countries with low replacement rates include Australia, New Zealand and Ireland, but while Canada and the United States are also below the OECD average, their replacement rates are 40% or more.
What this means is that an average earner in Britain who lost their job would experience a larger fall in income than in any other high-income country.
Chart 1: Net replacement rate (%) for unemployed single person in 2nd month of unemployment, OECD countries, 2019 (not including Housing Benefits)
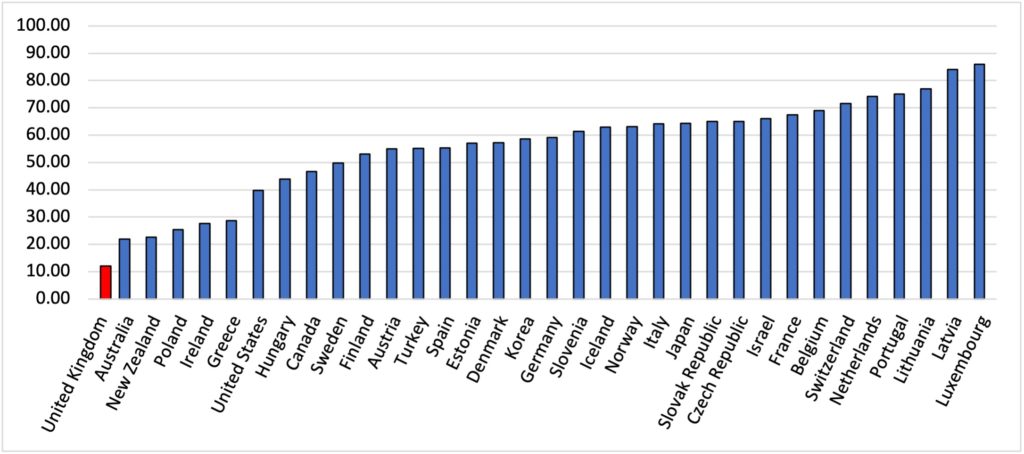
Source: OECD, Tax-Benefit web calculator.
What if we took a different measure of previous earnings? For example, the OECD also provide calculations of the net minimum wage which could be more relevant as a basis for comparisons, to the extent that lower-paid workers are more likely to experience unemployment than higher-paid workers, due to what is described as the ‘low-pay, no-pay cycle’.
In fact, using this approach means that the net replacement rate for the United Kingdom roughly doubles from 12% to 25%. However, even on this measure, the UK remains the lowest-ranked in the OECD for those countries that have a statutory minimum wage. This is because the majority of countries with statutory minimum wages set them in roughly the same range relative to the average wage.
What effect does including Housing Benefit have, remembering from the first post that the United Kingdom spends more on housing assistance than any other OECD country? Chart 2 shows that for this type of benefit recipient, the United Kingdom has the second most generous level of housing assistance in the OECD (just after the Czech Republic). This significantly boosts the level of support in the United Kingdom, but only moves it to the third least generous country in the OECD, ahead of Australia and Greece. This calculation is based on people paying 20% of the average wage for their rent; with lower rents, Housing Benefits are also lower and the United Kingdom would fall behind Australia and Greece.
Chart 2: Net replacement rate (%) for unemployed single person in 2nd month of unemployment, OECD countries, 2019 (including Housing Benefits for housing costs at 20% of the average wage)
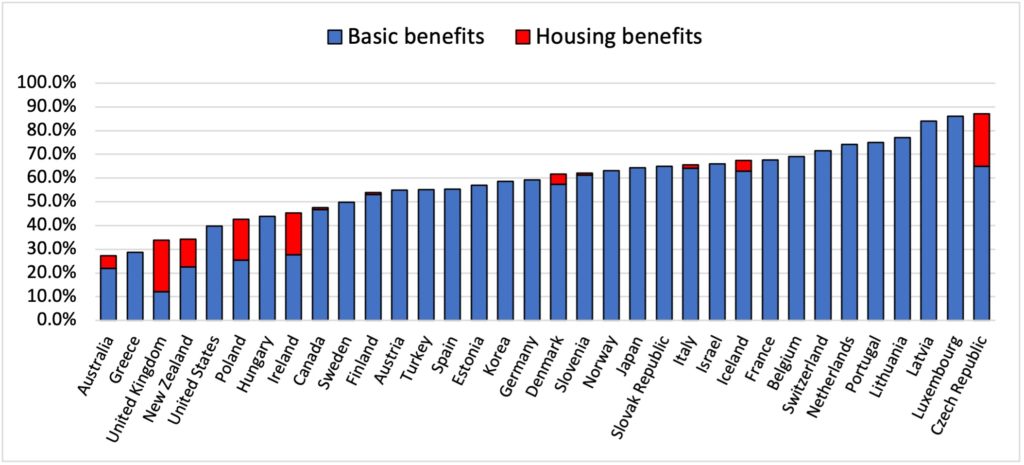
Source: OECD, Tax-Benefit web calculator.
An important feature of contributory social security systems is that benefits can reduce after specified periods of time. Flat-rate and essentially non-contributory systems like the UK are indefinite in their duration: unemployed people can continue to receive benefits for as long as they satisfy other eligibility criteria such as actively looking for work.
Chart 3 shows that the United Kingdom – in common with Australia, New Zealand and Ireland – pays the same level of benefits for someone unemployed for five years as for someone unemployed for two months. In the United States, in contrast, someone unemployed for five years no longer receives unemployment insurance, but is eligible for means-tested social assistance that is only 13% of their payments at two months. On average for OECD countries, a single person unemployed for five years would only get half the level of support they received when they became unemployed.
Chart 3: Ratio of net replacement rate for unemployed single person in 60th month of unemployment compared to 2nd month of unemployment, OECD countries, 2019
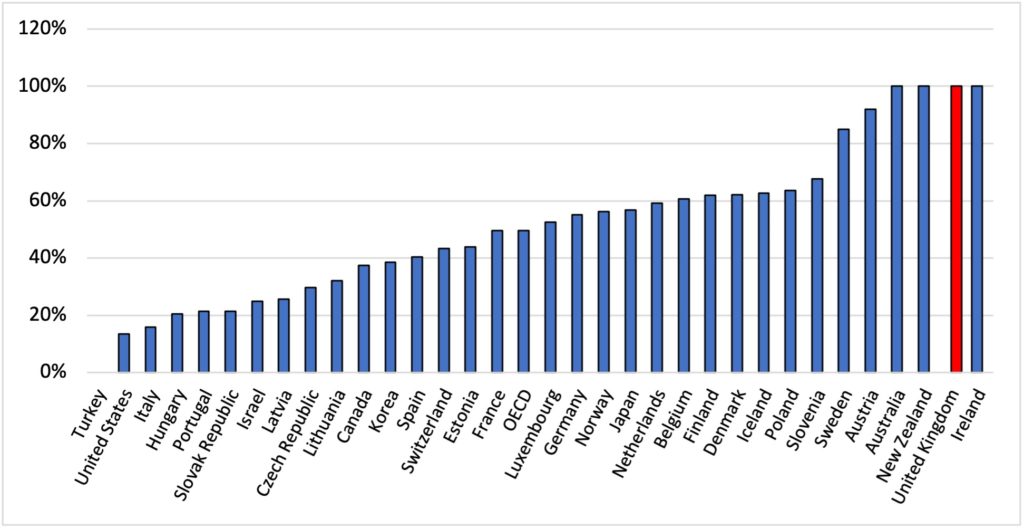
Source: OECD, Tax-Benefit web calculator.
This feature pushes the United Kingdom and some other countries up the OECD rankings; for a very long-term unemployed individual, the United Kingdom provides benefits that are higher than 16 other countries, placing it at very close to the OECD average, but still below 17 OECD countries. This is shown in Chart 4.
Chart 4: Net replacement rate (%) for unemployed single person in 60th month of unemployment, OECD countries, 2019 (including Housing Benefits for housing costs at 10% of the average wage)
Source: OECD, Tax-Benefit web calculator.
Another feature of these calculations is that the level of contributory benefits not only depends on how much unemployed people earned in their previous job, but how long they had been contributing to the unemployment insurance system. The calculations shown above all assume that the person is 40 years old, but has also made 264 months (22 years) of contributions to the relevant social security fund, i.e. they have been in continuous employment since the age of 18.
As discussed in part 2 of this series, social security systems in OECD countries are often characterised as either ‘Bismarckian’ or ‘Beveridgean’. Bismarckian programmes are based on social insurance principles, with earnings-related benefits, entitlements based on contribution records and funding through employer and employee contributions. Beveridgean policies are characterised by universal provision, with entitlement based on residence or need, and with flat-rate benefits financed through general taxation.
In fact, Beveridge argued that ‘Benefit in return for contributions, rather than free allowances from the State, is what the people of Britain desire’. But as Kate Bell and Declan Gaffney pointed out in 2012 in What is living and what is dead in the contributory principle? the contributory basis for social security in the United Kingdom has been eroded over the last thirty years by successive governments of all parties and by deep changes in the labour market. For example, by 2018 there were around 60 thousand unemployed people in the UK receiving the unemployment insurance payment but 1.2 million receiving income tested payments related to being out of work.
What happens to the UK’s position if we ignore contributory benefits, but only consider payments of last-resort – the ultimate safety net in each country compared with Universal Credit (plus relevant family benefits and housing benefit) in the case of the UK. These calculations are also based on the rules of the safety net systems operating in 2019.
Charts 5 to 8 show the relative rankings of different OECD countries in 2019 for four different household types – single people, lone parents with two children aged 4 and 6, couples without children and couples with two children (4 and 6 years). Because these calculations ignore any previous earnings of these households, the total benefit levels are expressed as a percentage of median net household income in each country. Median income is ‘equivalized’, that is, adjusted for the number of people living in the household.
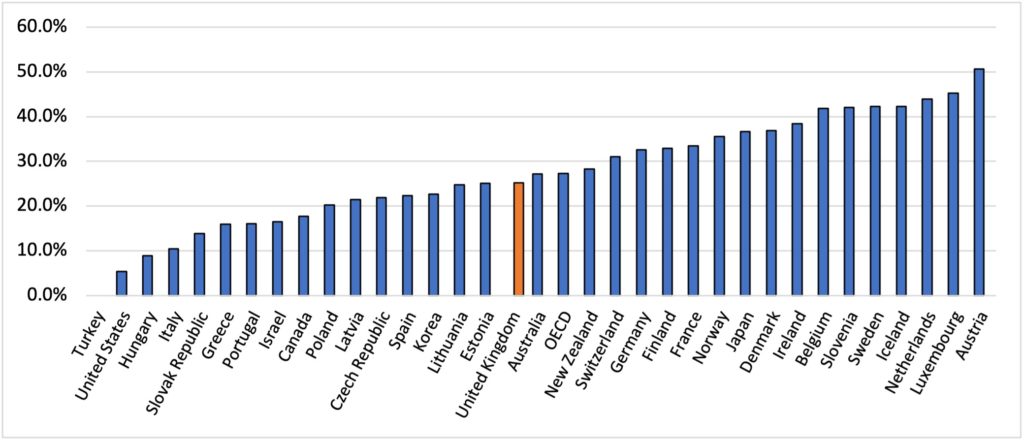
Chart 5: Level of minimum income benefits as % of median equivalized household net income, OECD countries, single person, 2019
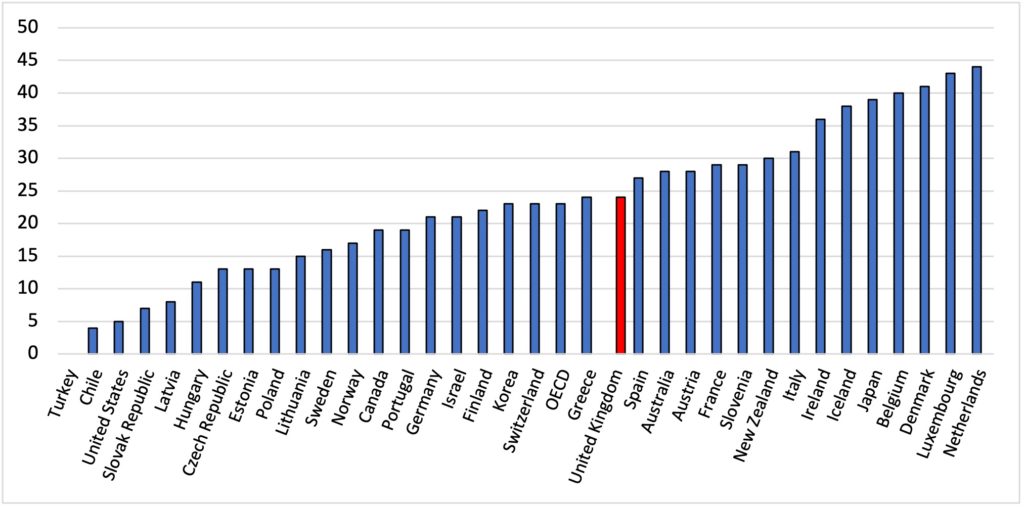
Source: OECD, Adequacy of Guaranteed Minimum Income benefits.
Chart 6: Level of minimum income benefits as % of median equivalized household net income, OECD countries, lone parent with two children, 2019
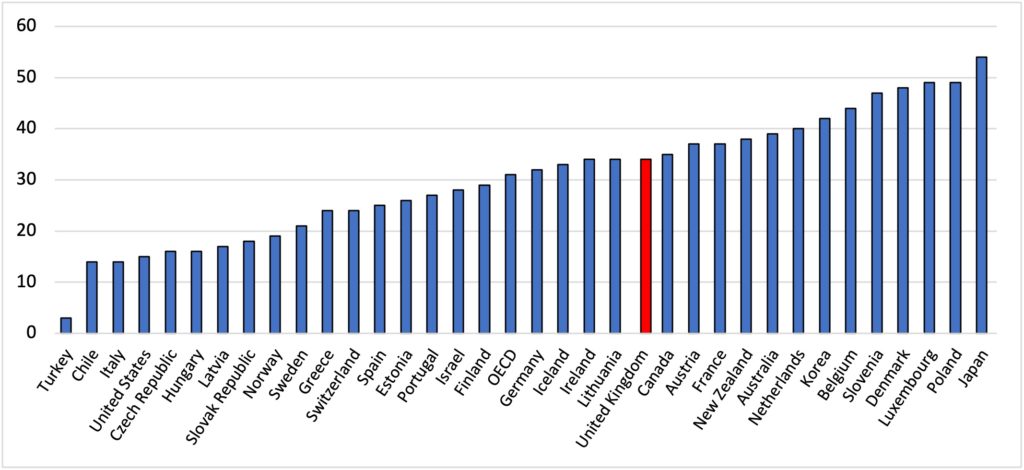
Source: OECD, Adequacy of Guaranteed Minimum Income benefits.
Chart 7: Level of minimum income benefits as % of median equivalized household net income, OECD countries, couple without children, 2019
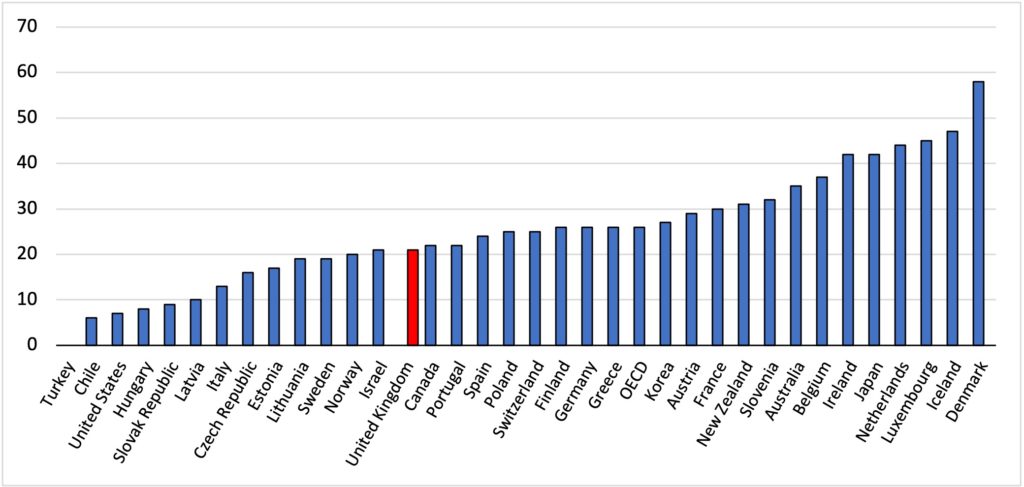
Source: OECD, Adequacy of Guaranteed Minimum Income benefits.
Chart 8: Level of minimum income benefits as % of median equivalised household net income, OECD countries, couple with two children, 2019
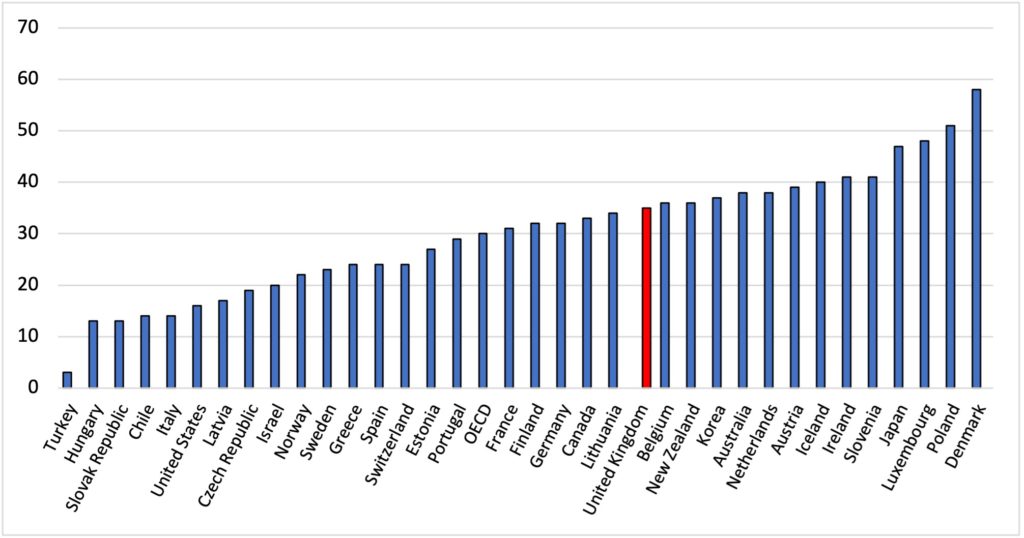
Source: OECD, Adequacy of Guaranteed Minimum Income benefits.
In terms of these safety net benefits, the United Kingdom is ranked more highly than it is in relation to contributory benefits for working-age households. For single person households, the UK is ranked 15th out of 34 OECD countries and is just above the OECD average (Chart 5).
For couples without children (Chart 7) the UK is ranked 22nd in the OECD at about 80% of the OECD average. For lone parent families with children (Chart 6), the UK is 14th in the OECD and 10% above the average, while for couples with children, the UK is again ranked 14th out of these 34 countries.
To sum up, the United Kingdom’s reliance on non-contributory benefits means that its assistance for people who are short-term unemployed is very far away from being generous. Strikingly, if you are an average earner who loses their job and don’t receive housing benefits, then the UK is the least generous country in the OECD.
Taking account of housing assistance and disregarding social insurance benefits does place the United Kingdom higher, but it remains the case that about one-third of the other high-income OECD countries have more generous minimum benefits.
In the final post in this series, I will look at what happened to benefit and spending levels during the COVID pandemic and subsequently.
First published at the IPR Blog on Thursday 17 November 2022. The IPR Blog is run by the University of Bath Institute for Policy Research (IPR). Read Part 1 and Part 2.


Recent Comments