
On 17 November, the Chancellor is now due to publish the government’s fiscal rules alongside an OBR forecast and further spending and taxing measures. We should then find out whether welfare payments will rise with inflation – 10.1% according to the latest figures – or be cut in real terms.
It is fair to say that there are opposing views on how to address the budget challenges facing the government. Social security is one of the largest areas of government spending. But it is also the area of spending that has the most direct impact on the wellbeing of low-income households.
In the Conservative Party leadership contest earlier this year, commenting on the cut in National Insurance contributions – which the Institute for Fiscal Studies estimated would be a gain of £7.66 for households on the lowest incomes, but those on the highest incomes could gain more than £1,800 – Liz Truss said that “to look at everything through the lens of redistribution is wrong”.
During that contest, Suella Braverman also argued that “There are too many people in this country who are of working age, who are of good health, and who are choosing to rely on benefits”. This argument was repeated at the Conservative Party conference in September, when by then Home Secretary Suella Braverman said she wanted to cut welfare spending due to a “Benefits Street culture” in the UK. Speaking at a fringe event at the conference, the home secretary again argued that “far too many people” are “fit to work” but choose to claim welfare instead.
Opposing views have been put. In the Spectator on 12 July, Stephen Daisley argued that “Braverman’s thesis is hopelessly wrong. ‘We spend too much on welfare.’ The UK dedicates roughly one-fifth of its GDP to social spending. That places us 17th – roughly in the middle – of OECD countries”.
The next day, the Editor of the Spectator Fraser Nelson disagreed, asking “how can there be a labour shortage and record joblessness?” and seeing this apparent difference as “a sign of a deep dysfunction in the welfare state”. (For what it is worth, the same argument has been put in Australia, which Bruce Bradbury and I discuss here – How can more people be on unemployment benefits than before COVID, with fewer unemployed Australians? Whether the same explanations apply in Britain is not clear.)
Many of these and related views reflect long-standing criticisms of the welfare state – as King and Ross put it in the Oxford Handbook of the Welfare State “From its origins, the welfare state has been periodically declared to be in crisis”. Criticisms include that welfare spending has become unaffordable, or that welfare provisions undermine financial incentives to work , or that they habituate people to being “dependent” on welfare.
How can these claims be assessed? In this series of posts, I will aim to look at the most up-to-date evidence on a range of issues about how generous the British welfare state actually is. First, I will look at how the level and composition of social spending in the United Kingdom compares with that in other high-income countries. Which countries spend the most and which the least? What do they spend it on?
The second post discusses some of the reasons for the variations in spending across high-income countries. In addition to variations in the need for social spending due to the age structure of the population and the level of employment and unemployment, welfare states differ in their design. The degree to which social security systems provide income replacement when people retire, lose their jobs or acquire a disability compared to whether benefit systems focus on the alleviation of poverty through means-tested benefits has a strong effect on how much is spent. It also structures the interaction between the taxation and social security systems, and the development and role of private or employer provision of social welfare.
In the third post, I discuss the available evidence on how the level of benefit entitlements compares across countries – what does the level of spending translate to in terms of the incomes of households receiving benefits and how adequate are these incomes? Related to this, how much does the benefit system reduce poverty and inequality?
The fourth post looks at the available evidence on how many people receive benefits and whether the UK has an unusually high number of people receiving benefits, as well as discussing trends since the onset of the COVID-19 pandemic.
In each of these posts, I draw on mainly statistics published by the OECD, which is generally the most up-to-date and comprehensive data source available. While some data are available for 2021, the most detailed breakdown of statistics refers to 2017.
How much is spent?
In 2020, general government public expenditure in the United Kingdom was 51.5% of GDP, compared to an OECD average of 48.4%, with the United Kingdom ranking as the 11th highest public spender among this group of nearly 40 high-income countries. However, as a result of the COVID-19 pandemic, public spending had increased very significantly between 2019 and 2020. Only one year earlier, the United Kingdom had spent 40.3% of GDP on general government spending, slightly less than the OECD average of 42.3%.
In most high-income countries, social expenditure is the most important part of total government spending. The OECD define social expenditure to include cash payments made to individuals (pensions, family benefits, social insurance and income-tested benefits), as well as services including health care, childcare, aged care as well as employment services. The main areas of spending are grouped according to the main categories of groups assisted – Old Age, Survivors, Incapacity-related benefits, Health, Family, Active labour market programmes, Unemployment, Housing, and Other social policy areas.
Overall social spending in the United Kingdom in 2019 was 20.6% of GDP – or roughly half of all government spending in that year. This was just above the OECD average of 19.8% of GDP, with the United Kingdom ranking 17th highest on social expenditure. (Chart 1)
Chart 1: Social expenditure (% of GDP), OECD countries, 2017
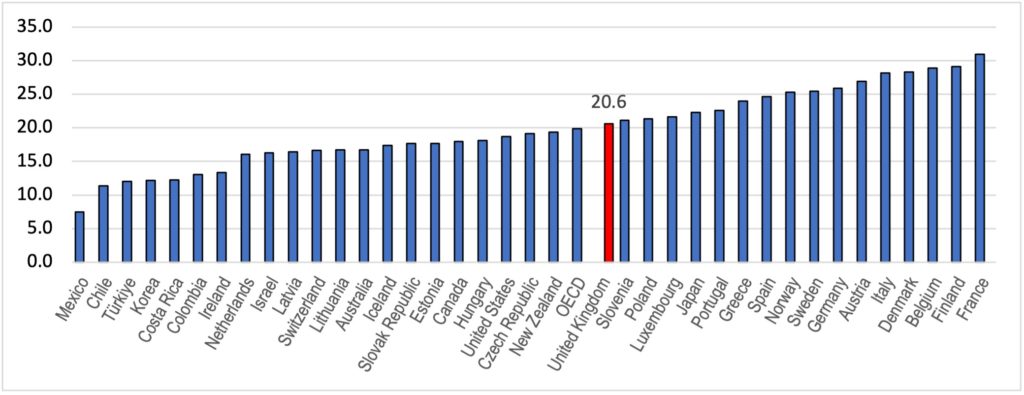
Source: OECD, Social Expenditure Database (SOCX) – OECD . Data extracted on 20 Oct 2022 from OECD.Stat
In 2017, more than half of this spending was on services, with UK spending on cash benefits (Chart 2) paid directly to individuals being 9.5% of GDP compared to the OECD average of 11.5%. placing the United Kingdom 24th highest.
Chart 2: Spending on cash benefits (% of GDP), OECD countries, 2017
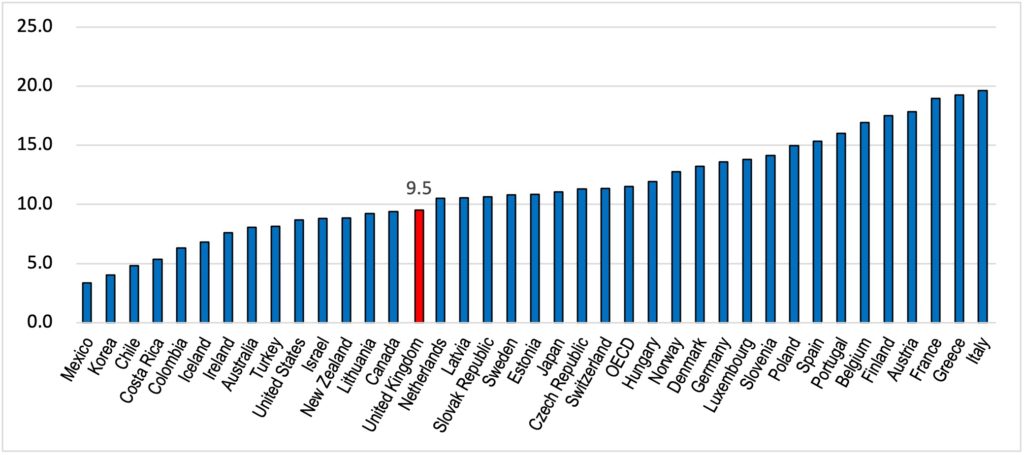
Source: OECD, Social Expenditure Database (SOCX) – OECD . Data extracted on 20 Oct 2022 from OECD.Stat
Spending on cash benefits for people of pension age was 5.6% of GDP compared to the OECD average of 7.0%, while spending on payments to people of working age (Chart 3) was 3.9% of GDP compared to the average of 4.5%. In both these areas, the UK ranked 27th in the OECD.
Chart 3: Spending on working age cash benefits (% of GDP), OECD countries, 2017
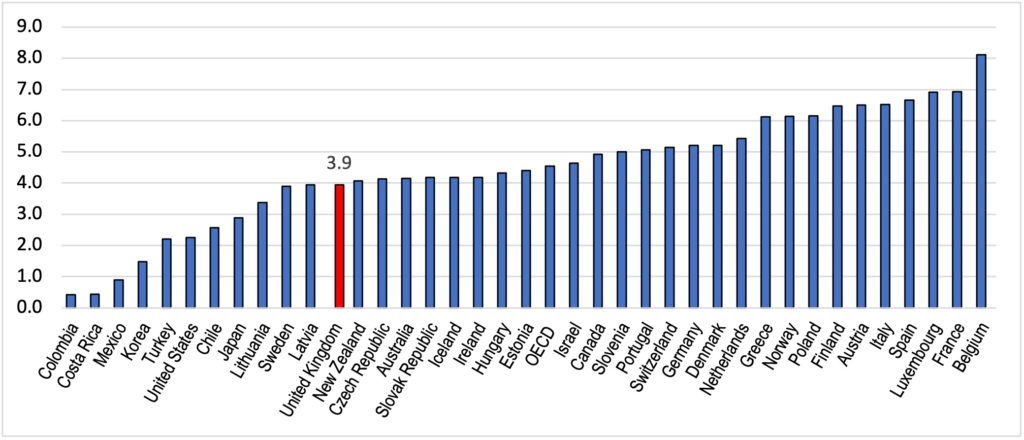
Source: OECD, Social Expenditure Database (SOCX) – OECD . Data extracted on 20 Oct 2022 from OECD.Stat
However, spending on family cash benefits at 2.1% of GDP was the second highest in the OECD and spending on housing benefits (cash and services) was 1.3% of GDP the highest level of all OECD countries (Charts 4 and 5).
Chart 4: Spending on family cash benefits (% of GDP), OECD countries, 2017
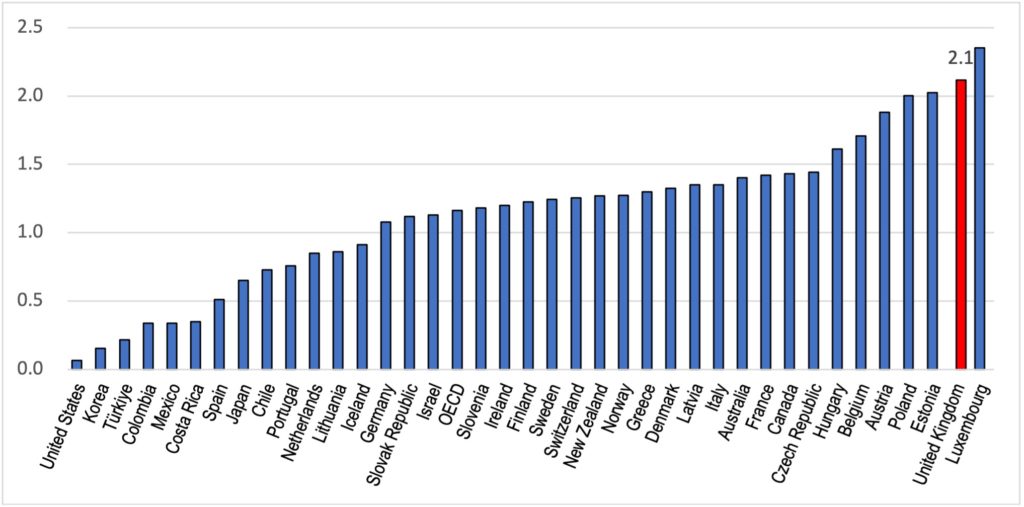 Source: OECD, Social Expenditure Database (SOCX) – OECD . Data extracted on 20 Oct 2022 from OECD.Stat
Chart 5: Spending on housing benefits (% of GDP), OECD countries, 2017
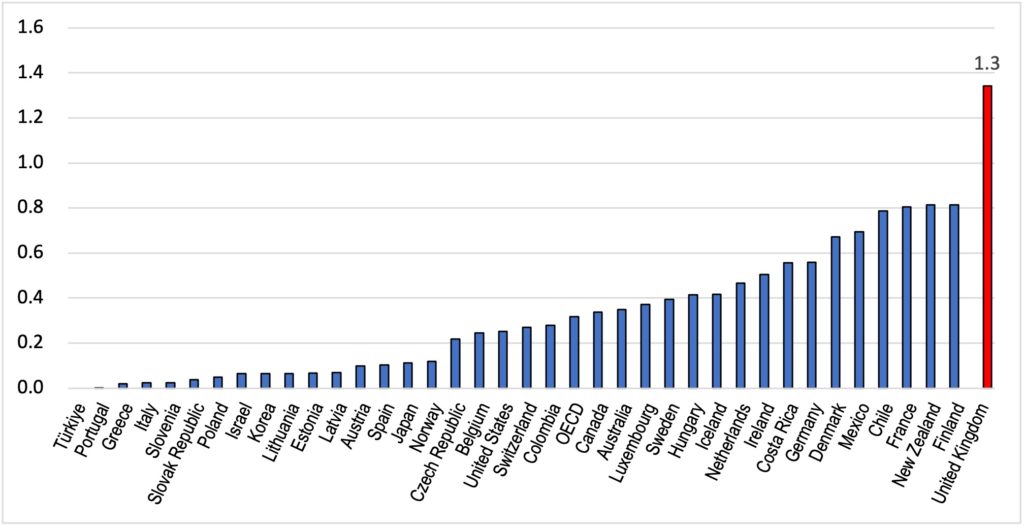 Note: Housing benefits include assistance in cash and in-kind, and assistance to pensioners as well as those of working age. Source: OECD, Social Expenditure Database (SOCX) – OECD . Data extracted on 20 Oct 2022 from OECD.Stat
The fact that spending on these areas of families and housing was well above the OECD average means that spending on other areas was well below. Most strikingly, spending on unemployment cash benefits was 0.1% of GDP compared to an OECD average of 0.6%, putting the United Kingdom at 33rd out of 36 OECD countries for which data were available (Chart 6). The UK unemployment rate at the time was below the OECD average, but with the UK ranking 28th.
Chart 6: Spending on unemployment cash benefits (% of GDP), OECD countries, 2017
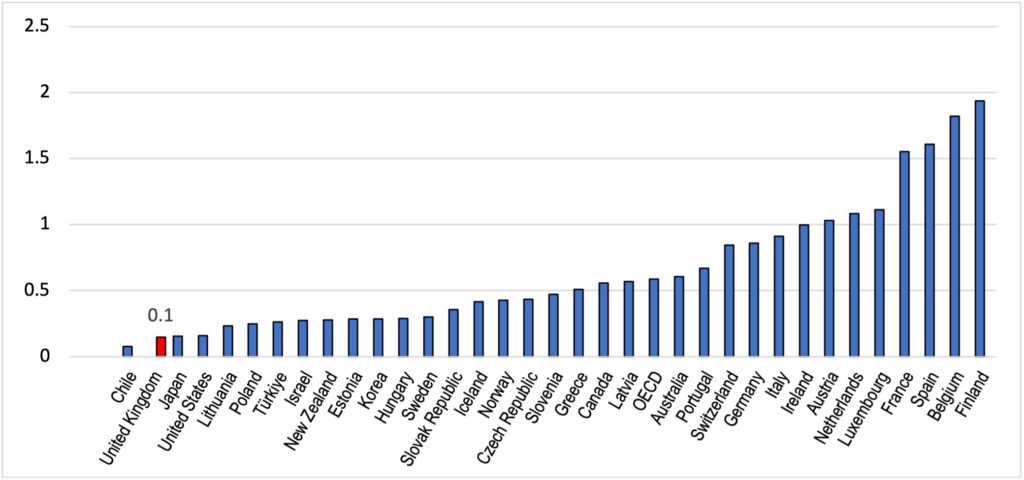
Source: OECD, Social Expenditure Database (SOCX) – OECD . Data extracted on 20 Oct 2022 from OECD.Stat
To conclude, this analysis of OECD data supports the analysis by Stephen Daisley in the Spectator on 12 July. (This is not surprising – we are using the same standard international data sources!) Social spending – while accounting for nearly half of all government expenditure in the UK – places the United Kingdom roughly in the middle of this group of high- income countries.
Looking at these figures in more detail, however, reveals that spending on cash benefits to people of working-age is further down the international ranking. The United Kingdom combines relatively high spending on families with children and on support for housing costs, but its support for the unemployed is amongst the lowest of all high-income countries.
There are further issues to consider about these figures, however. As suggested above, part of the reason for high spending on housing benefits is that spending on basic rates of payments is very low, and as will be discussed when looking at the benefits that households are entitled to, without housing benefits, these entitlements are among the lowest in the OECD. While spending on assistance with childcare costs is above the OECD average, this reflects the very high cost of child care in England, so that out of pocket expenses are the fifth highest in the OECD.
There is also a way in which the apparently high level of spending on family benefits is misleading. This is due to the high income tax clawback provisions on Child Benefit introduced in 2013. This has meant that high income families (over 50,000 pounds a year) pay higher income tax to reduce any Child Benefit they are paid. This will mean that the gross level of public spending on Child Benefit will differ from the net level of spending, since the clawback increases taxation rather than reducing spending.
This specific example illustrates why it is important when looking at differences across countries to also look at the role of the tax system and the design principles of the benefit system. These questions will be addressed next.
First published at the IPR Blog on Friday 28 October 2022. The IPR Blog is run by the University of Bath Institute for Policy Research (IPR). Read Part 2 and Part 3.


Recent Comments