

The value-added tax (VAT), or goods and services tax (GST) as known in Australia and some other countries, has gradually been adopted in more than 166 countries since it was first introduced in France in the 1950s. The tax has been regarded as a ‘money machine’ for government revenue and its rise is considered a significant development in tax instruments and tax administration. Proponents of VAT claim that it not only generates higher revenue but also improves the overall tax administration and compliance.
The maps in Figure 1 show the dynamics of VAT adoption across countries in 1970 (left panel) and in 2010 (right panel); countries that adopted VAT within the latest decade are marked in dark red (1960-1970 in the left panel; 2000-2010 in the right panel) and those that adopted in previous decades are in light red. Non-VAT countries are shown in white. There is a higher tendency for a country to adopt VAT if neighbours have already introduced one.
Figure 1: Comparison of Diffusion of VAT across countries (1970 and 2010)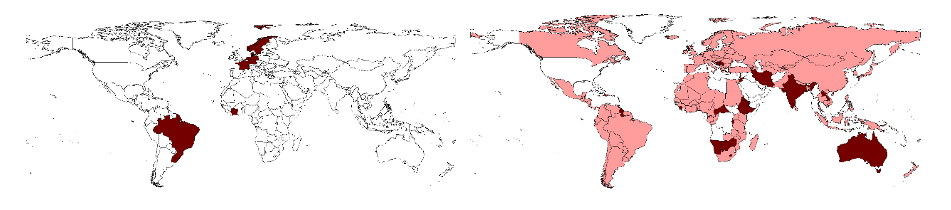 Source: Author estimation using VAT introduction data.
Despite its world-wide adoption, recent evidence shows that the effectiveness of VAT in revenue generation is not as desirable as expected mainly due to the informal economy, cash transactions, corruption, and lack of information on the true tax base in developing countries.
Keen and Lockwood (2010) find that the VAT adoption raised the overall revenue-to-GDP ratio modestly by about 4.5%; and that the effect is significantly stronger in rich countries because of their capacity to deal with administrative and compliance challenges of VAT. For Sub-Saharan countries, they even find predicted revenue loss. Additionally, Ahlerup et al. (2015) also find that VATs are not a solution to revenue shortages in African countries. Mudiyanselage et al. (2020) show that the tax-GDP ratio in Sri Lanka has been declining since 1990 and the introduction of VAT in 2002 did not change the downward trend.
The failed promise of VAT for developing countries is in line with what we found in Figure 2. The graph on the left shows the mean tax-GDP share has been rising over calendar years from 1980 to 2015. Yet, the graph on the right suggests no considerable difference in the average tax-GDP share before and after the VAT introduction.
Figure 2: Tax-GDP share based on calendar year and VAT year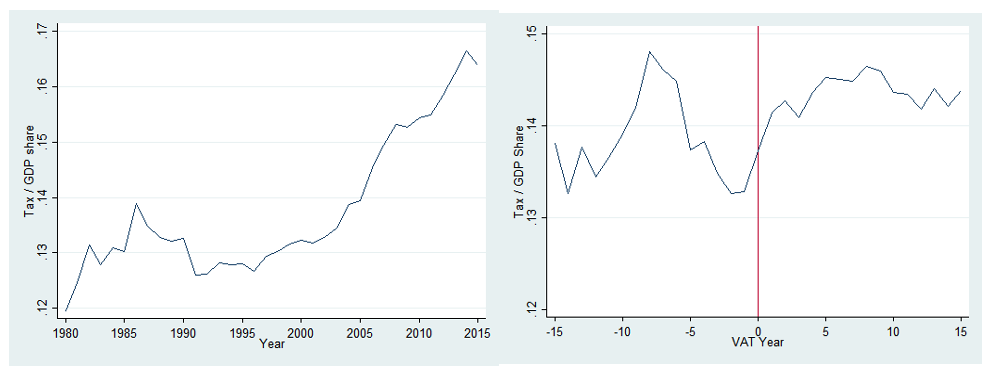 Source: Author estimation using ICTD and VAT introduction data.
Our study aims to investigate the main channels that constrain the effectiveness of VAT in developing countries. We measure a country’s tax capacity by using the ratio of tax revenue to the ‘true’ GDP, namely the sum of the reported GDP and the unreported shadow economy. Our new measurement allows us to identify changes in tax capacity due to the variation in informal sectors after the VAT introduction. We decompose the tax-‘true’ GDP ratio into three channels: effective tax rate, tax base and informal sectors.
Data and method
Our study considers 127 developing countries for the period of 1991 to 2015. The sample includes 105 countries with VAT and 22 countries with no VAT. Countries that introduced VAT have both VAT and non-VAT years within the sample period.
The study combines data from several sources. Tax share data are from the International Centre for Tax and Development (ICTD) database and we use the November 2017 dataset. VAT introduction data is from Annex 1 of ‘International Tax Dialogue – Key issues and debates in VAT, SME taxation and the tax treatment of the financial sector’ edited by Alan Carter (2013).
Our identification strategy combines the difference-in-difference method with VAT adopting neighbours as an instrumental variable. Countries differ in their VAT adoption time. This allows us to use the difference in difference approach by exploiting the variation across countries and over time. Additionally, we use the number of neighbouring countries with VAT as the instrumental variable to overcome any possible endogeneity in the identification.
Results
Figure 3 shows that there is no significant effect of VAT either on the total tax-GDP share (left panel) or on the indirect tax-GDP share (right panel), by comparing the years before and after the VAT adoption.
Figure 3: The effect of VAT on total and indirect tax shares Source: Author estimation using ICTD and VAT introduction data.
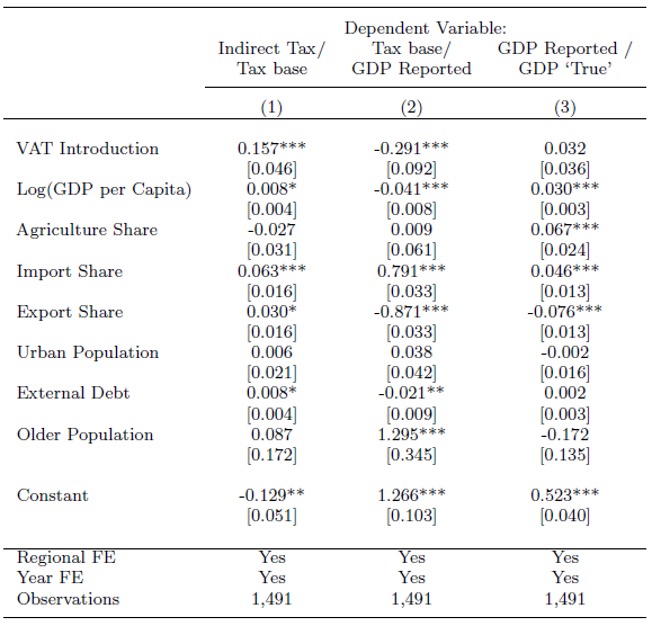
When investigating the mechanisms that might constrain the effectiveness of VAT, our result suggests that the behaviour response of the reported tax base (GDP) in formal sectors is the key constraint, instead of the unreported tax base in informal sectors. This is shown in Table 1.
In Column (1), we can see the introduction of VAT has significantly increased the effective tax rate. This suggests that the increase in tax capacity after the VAT introduction has mainly channelled through an increase in effective tax rate. In Column (2), there is a significant negative relationship between the tax base and VAT introduction. This indicates a decrease in tax base and the contraction may be due to the behavioural response by firms to the increase in effective tax rate. Column (3) suggests that the relationship between the informal economy and VAT introduction is not statistically significant. This means there is no change in informal sectors after the VAT introduction.
Table 1: Channels of VAT effect on indirect tax share
Improving VAT enforcement
Our research offers important policy lessons. VAT did raise a country’s tax-to-GDP ratio. However, the magnitude is modest in developing countries. It would not be effective as a ‘money machine’ unless the behaviour response of formal firms is addressed. This can be done via better enforcement technology and administration in developing countries to access more tax related information, to strengthen the incentive of tax enforcement, and to fix loopholes in the `last mile’ problem, that is, mis-reporting of retail sales to final consumers who do not require VAT invoices for tax deduction purpose.
This post is written based on the following publication: Mudiyanselage, H.K., Chen, S.X. What impairs the ‘money machine’ of VAT in developing countries?. International Tax and Public Finance 29, 1128–1159 (2022). https://doi.org/10.1007/s10797-021-09705-x


VAT is an engine of economic decline. It is a viciously anti-labour tax which does not allow for costs of maintains or crating the labour force. It is no surprise Europe is ageing.
Very subjective
Pingback: Happy Holidays from Austaxpolicy - Austaxpolicy: The Tax and Transfer Policy Blog