

The classical trade-off between equity and efficiency is central to income tax policy.
On the one hand, higher taxes imply more resources to redistribute; but on the other hand, they might negatively affect incentives to work and the reporting of income itself.
The design of tax and transfer policies, therefore, requires estimating the magnitude of behavioural responses to tax rate changes. Roughly speaking, the larger the responses to taxation, the smaller optimal tax rates should be.
What is the elasticity of taxable income? Why are deductions so crucial?
The elasticity of taxable income (ETI) summarises different types of behavioural responses to income taxation. This includes real economic responses (for example, labour supply adjustments), tax avoidance (such as legally claiming deductions or income shifting between tax bases) and illegal tax evasion behaviour. If we increase the marginal tax rate by one per cent, the ETI measures by how much an individual adjusts his or her income in response to a change in taxes.
Individuals might change their labour force participation or their working hours. Compared to labour supply elasticities, the ETI does not only account for real economic responses but reporting responses are captured as well.
Since many tax systems offer a range of deductions, they play a crucial role in defining the range of behavioural responses. Individuals may start to (legally) avoid taxes by changing the extent of spending on tax deductibles or they may (illegally) evade taxes by understating their income or claiming unjustified deductions.
My study
Despite the importance and the large body of empirical work, there is little consensus on the magnitude of behavioural responses towards taxation to be used in economic policy analysis.
In my paper, I provide a comprehensive quantitative survey to explain the pattern of estimates found in the empirical literature. In total, I collected 1,720 estimates extracted from 61 studies. My study consists of three parts: (1) a meta-regression analysis; (2) an analysis of the relationship between elasticity estimates and contextual factors; and, (3) an analysis of selective reporting bias.
To account for the central role of deductions and to disentangle real (or economic) and reporting responses by individuals, I explicitly differentiate between behavioural responses that are based on income concepts with or without tax deductions and allocate all reported elasticities to two subsamples: before and after deduction elasticities. In addition to real economic responses (such as changes in labour supply), after deduction elasticities account for reporting responses.
Figure 1: The distribution of elasticities
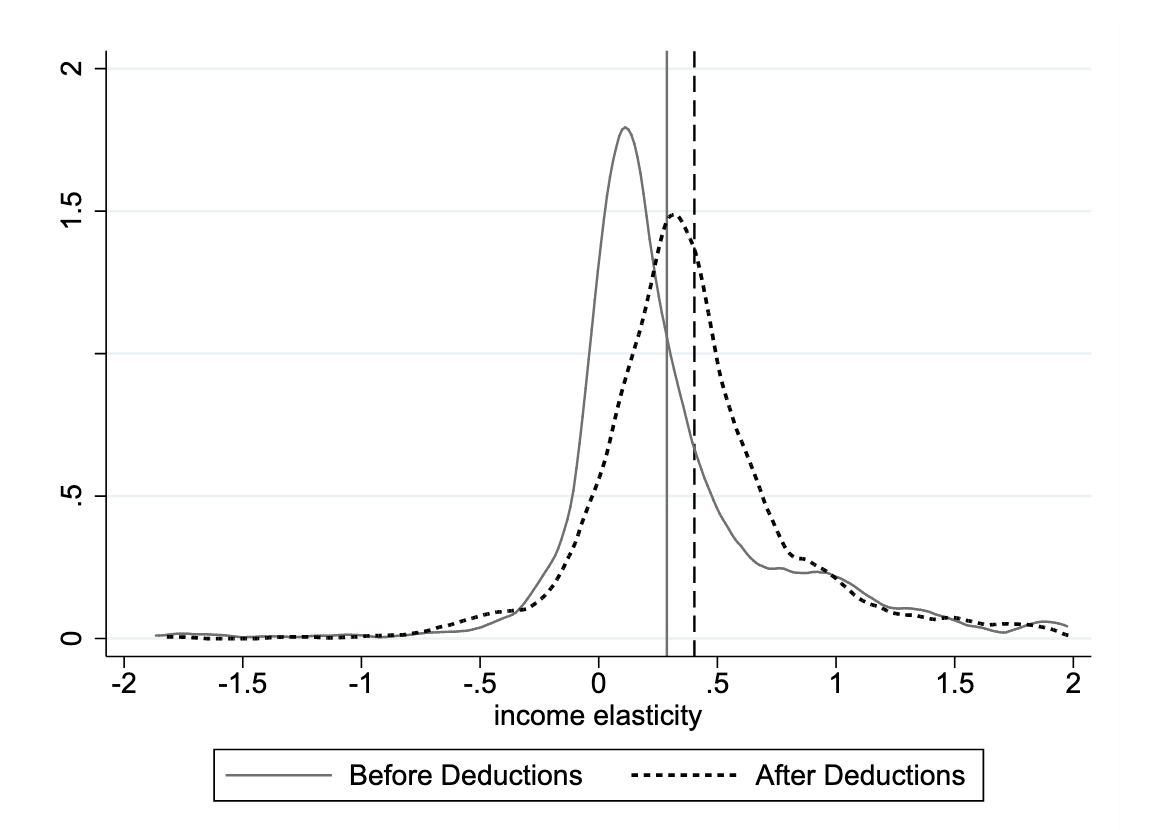
Notes: In total, there are 1,720 estimates. The distribution of before deduction elasticities are displayed as a solid line and the corresponding vertical line highlights the mean of 0.287 (N=940). The distribution of after deduction elasticities are displayed with a dashed line and the corresponding mean of 0.403 is highlighted with the vertical dashed line (N=780). Both figures are based on an Epanechnikov kernel with a bandwidth of 0.072.
Figure 1 plots the distribution of elasticities of both subsamples. The vast majority of estimates (90%) lies within an interval of -1 and 1, with a strong propensity to report estimates between 0 and 1 and both distributions reveal an excess mass between 0.7 and 1. The broader range of responses is reflected by larger after deduction elasticities. Within my sample, after deduction elasticities exhibit a mean of 0.403, while before deduction elasticities have a mean of 0.287.
I identified and assessed different explanations for the pattern of estimates found in the empirical literature. More precisely, I recorded different categories for each study (for example, empirical strategy or country) and quantitatively examined differences between elasticity estimates. Importantly, my meta-analysis provides a replicable statistical framework for summarising and assessing the full range of empirical evidence.
Stylised elasticity estimates and optimal revenue maximising tax rates
My results show that elasticities that account for deductions are not only larger by definition, but are also more sensitive to the estimation technique.
A calculation of stylised elasticity estimates documents a wide range of possible estimates. When accounting for the implemented estimation specification in primary studies, my regression results show that average before deduction elasticities lie in the range of 0.053 to 0.120, while average after deduction elasticities vary from 0.074 to 0.827.
What does this mean for tax policy analysis? My derived stylised after deduction estimates ranging from 0.074 to 0.827, lead to optimal revenue maximising tax rates between 44.63% to 90.01%.
Behavioural responses and inequality within an economy
I provide suggestive evidence that estimated elasticities are not immutable parameters. For example, there is a positive correlation between inequality measures and estimated elasticities. In particular, elasticities that account for deductions are highly correlated with top income shares.
A widening of the income distribution might be the result of past tax cuts for high-income earners. Such developments are insufficiently considered in the initial estimation of elasticities of taxable income, leading to an upward bias in resulting after deduction elasticities.
The prevalence of selective reporting bias
Selective reporting bias describes the fact that many studies or results have never been published because they did not reveal the expected sign, magnitude and/or significance (so-called ‘file-drawer problem’). The difficulty of publishing insignificant results, might lead to a variety of practices to generate ‘more suitable’ p-values (for example, collecting and playing with data until a significant threshold is met). Such behaviour is summarised by the term ‘p-hacking’.
Graphical evidence as well as regression analysis show selective reporting bias in the literature of taxable income elasticities. In general, there is a tendency to report significant results more often. The existence of ‘p-hacking’ is more pronounced among after deduction elasticities and among published articles compared to working papers.
Since the publication of Chetty (2009), before deduction (for example, gross income) elasticities have begun to receive more attention. This increased interest is reflected by a larger amount of ‘p-hacking’ within the before deduction subsample for estimates published after 2009. In addition, I observe excess (distributional) mass around 0 to 0.4 and below 1.
These anomalies in the distribution of estimates suggests that results are more likely to get reported because they are in line with theory and existing evidence. In general, there is an upward reporting bias for before deduction elasticities. For after deduction elasticities, the reporting bias goes in both directions, while the downward bias appears to be more dominant.
Implications
As already acknowledged in the literature, the ETI is not a structural parameter and my study shows that policy conclusions can be misleading.
Reported estimates need to be interpreted within the context they are estimated. Researchers and policymakers need to be careful about the type and size of elasticity that should be used for policy analysis (for example, when calibrating an optimal tax model).
To develop new (empirical) strategies that are robust to certain model choices, we need to raise the awareness that insignificant and even implausible estimates are meaningful. Instead of providing a single estimate, a range of estimates might help to shed light on the heterogeneity of behavioural response across the income distribution and different socio-economic groups.
Further reading: Neisser, Carina (2021), ‘The Elasticity of Taxable Income: A Meta-regression analysis’, The Economic Journal (accepted), latest working paper version can be found here: ECONtribute Discussion Paper No. 067 Link: https://www.econtribute.de/RePEc/ajk/ajkdps/ECONtribute_067_2021.pdf.


Recent Comments