
Worldwide, obesity has nearly tripled since 1975 because of changes in diet and physical activity patterns. This is a cause for concern as overweight and obesity are major risk factors for non-communicable diseases such as type 2 diabetes, cardiovascular disease and some cancers.
In line with economic theory, health-related food taxes and subsidies are increasingly being recognised as an important instrument to decrease the externalities of food consumption, with regard to public health outcomes and climate change. In particular, taxes on sugar sweetened beverages (SSBs) – intended to discourage purchases and consumption of SSBs – are increasingly being used as a strategy to prevent and reduce overweight and obesity around the world. This is because SSBs are a well-defined food category and have no positive contribution to health. Amongst many others, a study by Teng et al. (2019) showed that SSB policies indeed effectively discourage the purchases and consumption of SSBs. However, decreases in SSB purchase alone are unlikely to curb current obesity trends.
There is also growing evidence supporting the effectiveness of health-related food taxes beyond sweetened beverages. Recently, the Price Experiment and Modelling (Price ExaM) study aimed to expand this evidence by using a new combination of methods including a virtual experiment, econometric methods to estimate price elasticities, and public health intervention modelling to estimate health gain and health cost after the introduction of several health-related taxes and subsidies.
In one Price ExaM study, we measured the effect of a subsidy on fruit and vegetables, a sweetened beverage tax, and taxes on foods according to sugar, sodium, and saturated fat content on how much (un)healthy food was purchased by consumers. In a second Price ExaM study, we examined the effects of these subsidies and taxes on how much people substituted or switched to other brands within specific food groups, such as snacks, including from unhealthier to healthier alternatives and between brands. The studies, their methods, results and implications are discussed below.
A virtual supermarket
The New Zealand virtual supermarket creates a realistic three-dimensional computer simulation of a real supermarket mirroring the in-store environment of one of the leading supermarket brands in New Zealand.
Over 1,000 participants were asked to do their weekly household shopping in the virtual supermarket where they were exposed to a different randomly selected price set for each shopping experience. Thus, during each shop, the prices of products within the virtual supermarket varied, leading to 5,000 different price sets. The price sets were designed to resemble New Zealand usual shopping prices (control), and one or more of five different price change options (with 20% and 40% tax options) emulating a beverage tax, a saturated fat tax, a salt tax, a sugar tax, and a fruit and vegetable subsidy.
These different price sets allow for the calculation of price elasticities. Price elasticity is a measurement of the change in purchases of a product in relation to a change in price. In the case of own-price elasticities, it is a change in relation to the product’s own price; and in cross-price elasticities, it is a change in relation to another product’s price.
Results
The first article reporting on the main results of the Price ExaM study found that healthy purchasing increased significantly under the saturated fat (SAFA) tax, sugar tax and salt tax (Figure 1).
Figure 1: Percentage changes for intervention policies compared to control
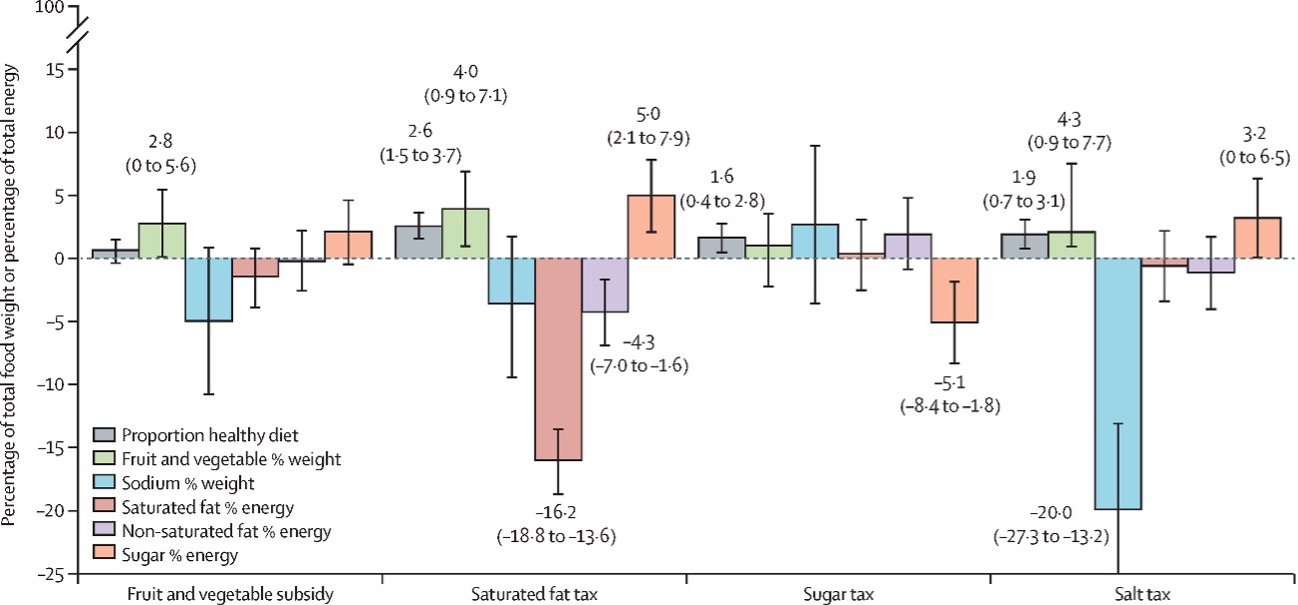
Data labels are for percentage changes (with 95% confidence interval) if the shift was statistically significant, but 95% confidence interval error bars are shown for all estimates.
Figure 1 shows the percentage change of total food weight or total energy after the introduction of the saturated fat tax, sugar tax, salt tax or fruit and vegetable subsidy. For example, it shows that there was a statistically significant difference in the total proportion of healthy foods purchased in the SAFA, sugar and salt tax scenarios (grey bars in Figure 1; SAFA tax mean absolute difference 2.6%; sugar tax 1.6%; salt tax 1.9%). Figure 1 also demonstrates that substitution purchases have taken place; after the introduction of a SAFA and salt tax, purchases of sugar as a percentage of energy increase by 5.0% and 3.2%, respectively (orange bars in Figure 1).
Based on the results that SAFA, sugar and salt taxes are able to decrease the purchases of these nutrients, in the second article we decided to explore whether individuals substitute foods high in SAFA, sugar and salt for foods with lower amounts of SAFA, sugar and salt within the same food group. Figure 2 displays the change in demand as a result of a price increase in SAFA, sugar or salt.
Figure 2: Change in demand (%) as a response to a 1% price increase of low, medium or high saturated fat (SAFA)/sugar/salt containing categories
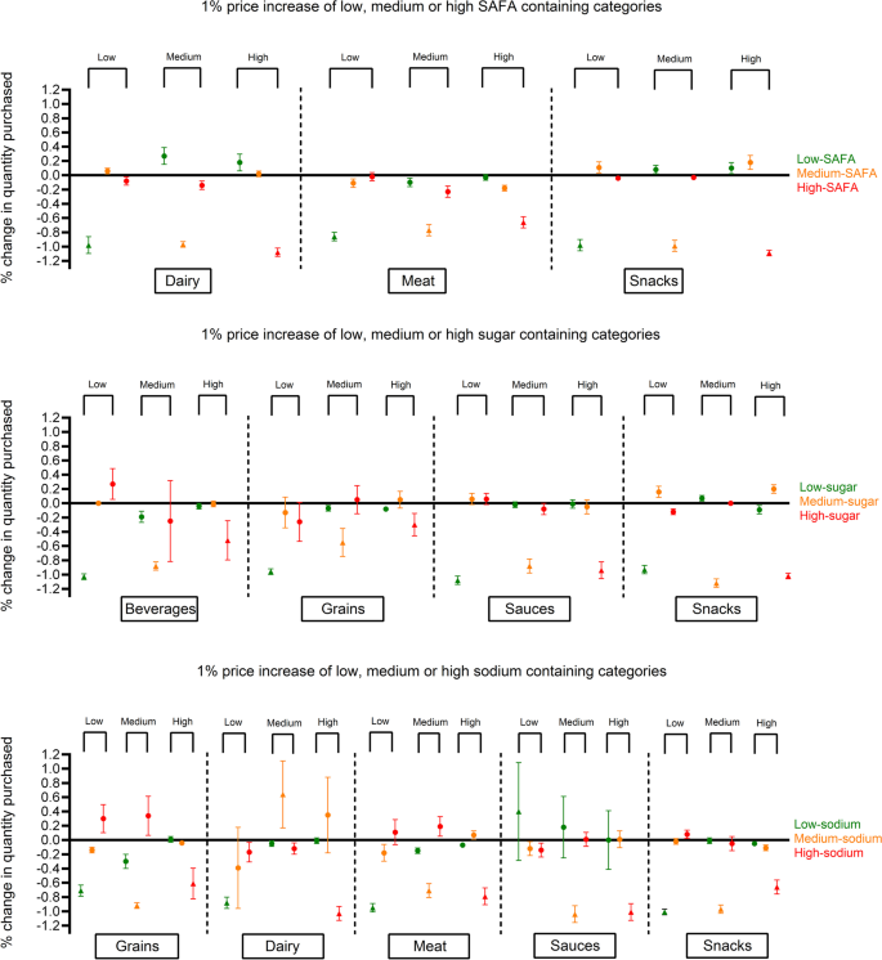
Triangles represent own-price elasticities and circles represent cross-price elasticities. The Figure can be interpreted as follows; as seen in the upper-right section in Figure 2, a 1% price increase of high-SAFA foods is associated with a 1% decrease in purchases of high-SAFA foods (as indicated by the red triangle under the ‘high’ column). Figure 2 demonstrates that own-price elasticities were largely inelastic (smaller than 1 in absolute value). Both substitutive (Figure 2; symbolised by the dots above the zero) as well as complementary (Figure 2; symbolised by the dots below the zero) relationships with other foods within the same nutritional cluster were found. For example, a 1% increase in the price of high-sugar snacks (Figure 2; middle section all the way to the right) was associated with a 0.1% decrease in purchases of low-sugar snacks and a 0.2% increase in purchases of medium-sugar snacks. Overall, no consistent pattern of substitution or complementary purchasing within nutrient categories was evident.
Implications
The results show that healthy purchasing increased under the SAFA tax, sugar tax, and salt tax, while the sweetened beverage tax and fruit and vegetable subsidy had no significant effects on the total units of healthy food purchased. This increase in healthy purchasing was only slightly explained by substitution and complementary effects within food groups.
The largely inelastic own-price elasticities and the even lower own-price elasticities of high SAFA, sugar and salt clusters compared to low clusters suggests that, when implementing taxes to achieve health goals, it is preferable to apply substantive taxes of above 20%. This is also in line with WHO recommendations. Although the percentage decrease in purchases is disproportionate to the percentage increase in price, larger taxes will lead to larger purchasing changes compared to smaller taxes.
The effect sizes found in these studies cannot be directly translated to the real-world. For example, the effect of taxes and subsidies applied in a real-world setting will depend on how the food industry reformulates food, the food regulatory environment that such taxes and subsidies are introduced into, and any accompanying public health messaging (for example, improved nutrition labelling). Such actions could change the price elasticities of products.
Conclusion
Combinations of tax and subsidy options, accompanied by codes of practice with and regulation of the food industry might yield the best improvements in population diets and mitigate potential unintended consequences. It is unlikely that taxes and subsidies alone are the solution to curbing the obesity epidemic. Improving diet quality for entire populations requires systemic change across food producers, manufacturers, retailers, consumers, and governments.
Thus, while implementing taxes and subsidies would be a step in the right direction, more needs to be done at different levels and scales to improve diet qualities and reduce the prevalence of obesity.


Recent Comments