

Stamp duty is a significant component of the Australian taxation system. It accounts for around 20 per cent of state governments’ own-source revenue. At the time of transfer of property ownership, the buyer pays stamp duty at an increasing rate on the improved value of property, with schedules varying from state to state.
Stamp duty is a highly inefficient tax. It imposes additional transaction costs on transferring property. A larger transaction cost distorts homeowners’ decisions about changing property when life circumstances change, like having new children, receiving employment opportunities, or realising an increase in income. Studies have estimated the economic costs of stamp duty per dollar raised (known as the excess burden) to be the highest of Australia’s main taxes.
Those who transfer property ownership more (less) often than the average will, all other things being equal, pay more (less) stamp duty over time than the average. These people, despite not necessarily consuming more of the services provided by state governments (like education, transport, and health services), end up contributing more (less) to them than others in a similar position. An ideal tax would have minimal horizontal inequity.
Given these features, stamp duty has been touted as an ideal target for tax reform. There have been proposals (including by the Productivity Commission, the Henry Tax Review and the Australian Housing and Urban Research Institute) to replace stamp duty with an annually charged land tax. The switch could be implemented in a way which does not alter overall tax revenue. For example, the Australian Capital Territory (ACT) has successfully adopted a 20-year strategy to slowly decrease the current stamp duty and replace revenue with a slow increase of the replacement land tax. This means the efficiency and horizontal equity gains are only being slowly realised. Reforms would lead to much lower efficiency costs, better use of the national housing stock, provide more horizontal equity, and give state governments a significantly less volatile revenue source.
Our paper, recently published as part of the Melbourne Institute’s Working Paper series, adds to the reform arguments by estimating the adverse horizontal and vertical inequity effects of stamp duty on the transfer of property. We combined data from the Household, Income and Labour Dynamics in Australia Survey (HILDA), the Australian Bureau of Statistics, SQM Research and state government tax schedules to infer the distribution of stamp duty’s costs across different groups, including by category of income, wealth, and age.
Economic and statutory incidence of stamp duty
Stamp duty is paid, notionally, by the buyer of a property – that is, the person who buys the property transfers funds to the relevant statutory revenue office. However, this is only one side of the picture. The tax induced lower demand by buyers leads to changes in the price of housing sold. As a result, some of the economic incidence will fall on the seller as a lower house price.
There is some debate and uncertainty about the factors which impact the magnitude of this economic tax incidence effect (in other words, the relative elasticities of supply and demand). Generally, some of the incidence will fall on the buyer and some will fall on the seller. Over the long term, property buyers tend to be both buyers and sellers. Our analysis finds that, given this, the actual split of incidence between buyers and sellers is not critical to assessing equity effects.
Stamp duty imposes horizontal inequity
We analysed HILDA data on the length of occupancy of homeowners to understand the magnitude of horizontal inequity. We found significant variation in the occupancy length of individuals at a given point in time (see Figure 1). Individuals who find themselves on the left of the graph pay much more stamp duty relative to otherwise similar individuals who move less frequently (those on the right of the graph). Our analysis showed that this variation is significant within income groups and age groups as well, suggesting that even those with similar features do not necessarily have similar mobility patterns.
Figure 1: Distribution of occupancy length of homeowners
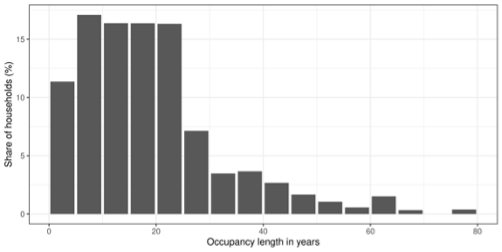
Under a replacement annual land tax, there would be limited horizontal inequity on this margin: each household would simply pay an annual amount based on the value of their property. If the land tax rates were proportional to the stamp duty schedule, households with about an average frequency of property transfer would pay about the same tax over time under the reform. Households which move more (less) frequently than the average would pay less (more) tax over time under this proposed reform package.
Stamp duty is regressive on income
Despite stamp duty being charged at an increasing rate on the value of property transacted, we find that it is a regressive tax on income. Low-income households pay a higher share of their income on stamp duty each year (on average) than high income households. The main reason is that low-income households tend to spend a larger share of their income and expenditure on housing than those with higher incomes. The impact of higher stamp duty rates for expensive properties is not, based on our evidence, enough to make the tax progressive.
We quantified the magnitude of this effect, by analysing the mobility patterns of Australian households, including assumptions about pass-through of stamp duty on the residential rental market, under a variety of scenarios of the share of economic incidence among buyers and sellers and renters and investors (see Figure 2).
Figure 2: Distribution of house values (absolute and as a share of income) of homeowners
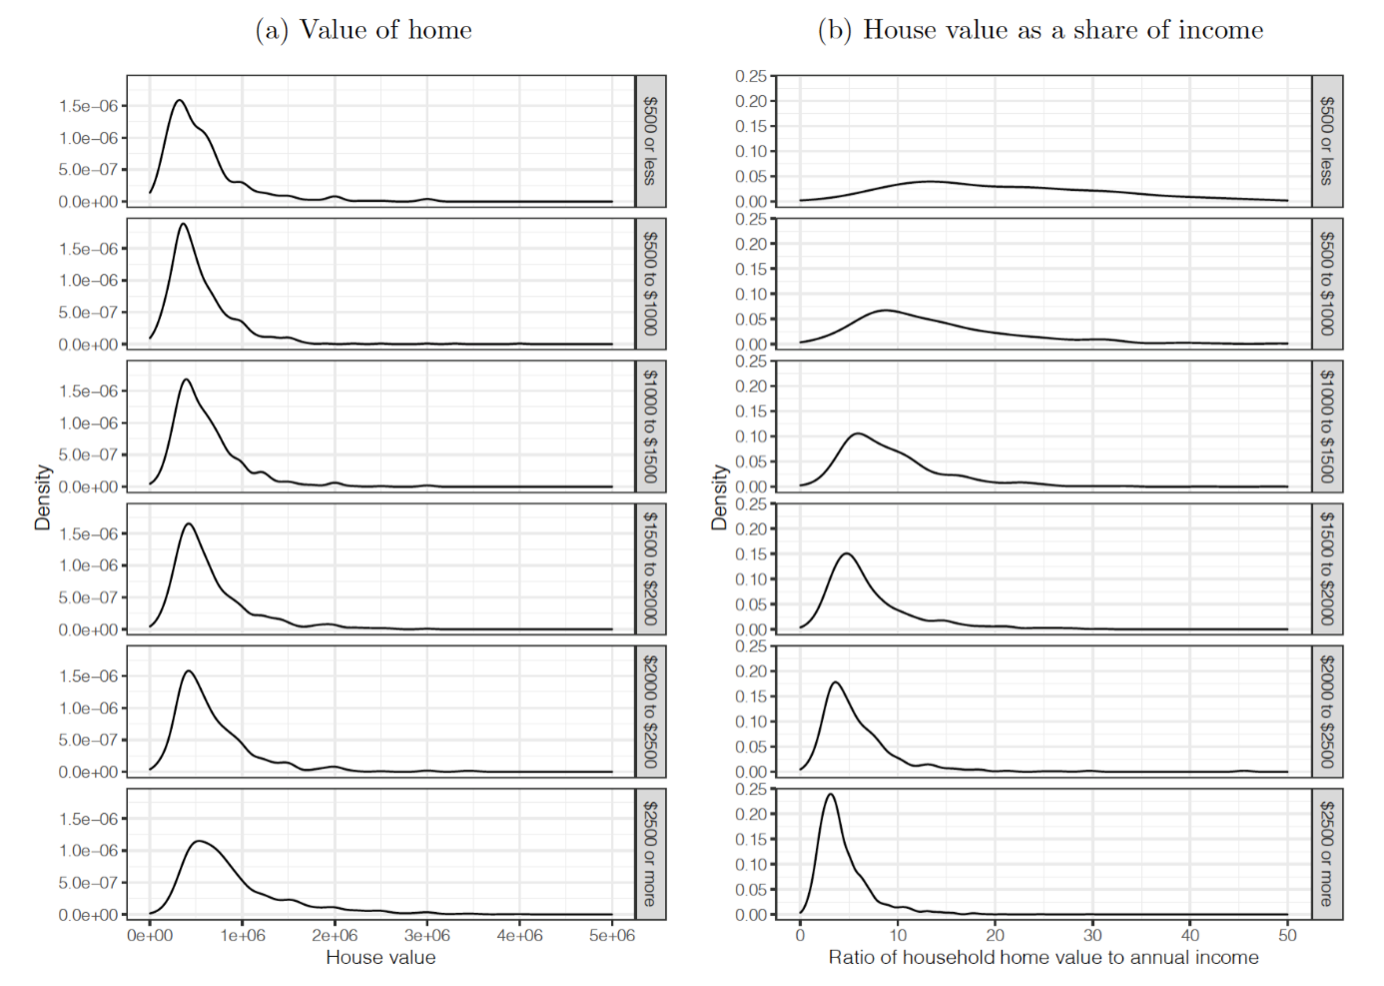
Note: Each graph shows the probability distribution for (a) house value and for (b) house value as a share of income. Movement down the list of graphs is from lowest income category to highest income category, defined as weekly household income.
The probability distributions in Figure 2 show that for the average household and over time for different income groups, stamp duty costs are between three to four times the share of annual income for low-income households (those earning less than $500 a week) than high income households (earning above $2000 a week). Those in their thirties also tend to pay more stamp duty as a share of their income when compared to those in their forties and fifties. Low-income homeowners tend to move less often than high-income homeowners. If these homeowners were to have similar mobility patterns, stamp duty would be even more regressive.
These findings are significant in the context of understanding progressivity of the Australian tax system. For a reform package replacing stamp duty with an annual land tax to avoid being regressive, it would need to be designed with a schedule which increases the relative rate of tax on higher house prices to lower house prices than the current stamp duty schedules.
Implications for reform proposals
Moving from stamp duty to land tax would have several desirable impacts for state governments. It would remove an inefficient tax, and reduce horizontal inequity associated with differences in mobility rates and provide them with a more stable revenue source. To reduce vertical inequity, the land tax would require a schedule which increases the rate of tax even more quickly on house prices than the current stamp duty schedules.
The transition to a land tax has been hampered by political difficulties. As is usually the case with tax reform, it is difficult to enact without creating winners and losers or imposing windfall losses on specific groups within society. A particular concern is a form of double taxation for those who have purchased a property recently and paid stamp duty and then are required to pay the annual land tax. Interesting transition mechanisms proposed to address this concern include providing home buyers a choice in which tax they pay, and the provision of a credit for recent paid stamp duty.
Most of these reform opportunities would impose a significant short term financial cost on state governments. Given ongoing state government deficits and an enduring vertical fiscal imbalance, state governments’ appetites for this reform may continue to be limited. Considering the large opportunities which such a reform could afford, it may be time for the Federal Government to step up and provide transitional financial incentives to support the reform.


Thank you for the post. It is great to have some data to inform this discussion. However, am I right in reading the distributional analysis as focusing only on home ownership? I imagine a considerable portion of tax receipts come from investors (because they buy and sell more regularly), who are also more likely to be high income and wealth. Have you done any analysis of the overall incidence? Also wondering if your analysis took account of concessions for first home buyers.
As pensions buying in nsw (not first home) but primary residence this tax .stamp duty is an abomination it is a knife in the back for someone who at 80 yrs worked and paid taxes in this country,, it is a cuel blow for my husband and self a huge overpriced grab that reeks of excess.in this era of inflated house pricmes hard enough to make house price now we need a huge ammount
of money for tax which we have a l l ready paid all our working life.
Help carolyn
I agree with Carolyn and Robert. We have just sold our home after residing in it for 37 years. The decision to sell is an emotional one to downsize into a smaller home and a more manageable one. We are pensioners and have both worked very hard most of our married life life. To be hit with such a huge tax on purchase is a real slap in our face after paying tax all of our working life. What do you get in return for this, a rubber stamp stating you are the new owners of this land. At least there could be a considerable discounted rate for pensioners . The government seriously need to look at the needs of pensioners and reduce the stamp duty rate