

It has long been recognised that it is important to look at taxes and transfers together (Podger, Raymond and Jackson, 1980; Treasury, 2008) for three main reasons:
- taxation is the source of financing for welfare spending – and welfare spending is one of the most significant uses to which tax revenues are dedicated;
- the tax and transfer systems overlap and can reinforce or offset each other, with implications for incentives to work and save and for household formation and other behaviour; and
- the tax and transfer systems are the two main policy instruments used by governments to achieve distributional objectives.
In particular, if we want to assess the impact of the taxation and welfare systems on the distribution of economic wellbeing we need to think of them as a combined system and take account of their net impact.
For analytical purposes, however, it can be useful to consider each system separately in order to understand their separate effects on the distribution of income. In this article, I look at the progressivity of transfers and how Australia compares to other OECD countries.
In considering the impact of the tax-transfer system on the distribution of income it is also important to clarify the underlying concepts, and in particular to distinguish between targeting, progressivity, and redistribution.
Targeting is a means of determining either eligibility for benefits or the level of entitlements for those eligible. All benefit systems – apart from a universal basic income scheme – are targeted to categories such as the unemployed or those over retirement age. Income and asset-testing is a further form of targeting that can be applied once people satisfy categorical eligibility criteria.
Progressivity refers to the profile of benefits compared to market or disposable incomes – how large a share of benefits is received by different income groups – do the poor receive more than the rich from the transfer system?
Redistribution refers to the outcomes of different tax and benefit systems – how much does the benefit system actually change the distribution of household income?
In this context, the Australian tax-transfer system differs markedly from those in other OECD countries, particularly on the transfer side. In Europe, the United States and Japan, most cash transfers are financed by contributions from employers and employees, with benefits related to past earnings, so higher income workers receive higher absolute levels of benefits if they become unemployed or when they retire.
In Australia (and New Zealand), benefits are flat-rate entitlements financed from general revenue, and there are no separate social security contributions. In both countries, benefits are income-tested or asset-tested, so payments reduce as other resources increase. The rationale for this approach is that it provides the most efficient means of reducing poverty, by concentrating available resources on the poor (“helping those most in need”), while minimising adverse incentives by limiting the overall level of spending and taxes.
Accompanying this unusual transfer system, the Australian tax system has a relatively high reliance on income taxes – mainly reflecting the absence of social security contributions, but also relatively low levels of broad-based consumption taxes (GST or VAT).
Figure 1 shows spending on cash transfers in OECD countries in 2014. Because benefits are flat-rate and income-tested, Australia was the 6th lowest spender in the OECD, spending 8.6 per cent of GDP, with the only countries spending less mainly being lower income like Mexico, Chile and Turkey.
Figure 1: Spending on cash transfers, OECD countries, 2014 (% of GDP)
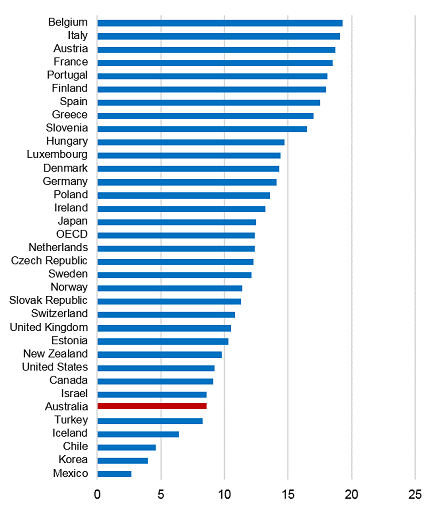
Source: OECD Social Expenditure database.
Figure 2 shows spending on income-tested cash benefits in 2012 (the most recent year for which data are available. Australia stands out, spending close to 80 per cent of its total benefit spending on income-tested cash benefits, or 6.5 per cent of GDP. The Australian share of spending on income-tested benefits is more than four times the OECD average. Iceland, Canada, Israel and New Zealand come next after Australia, but New Zealand with whom Australia is most often compared spends roughly half this share on income-tested payments.
Figure 2: Share (%) of cash benefits income or means tested, OECD countries, 2012
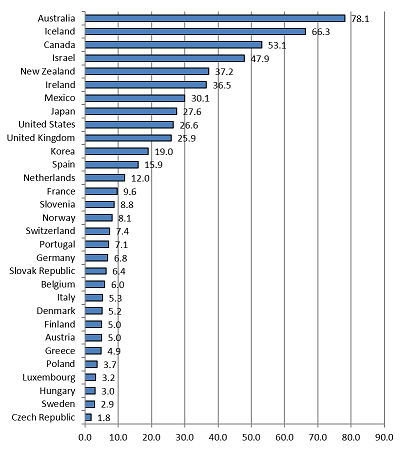
Source: OECD 2014.
As noted, Australia has by far the highest share of spending on income-tested programmes of any OECD country. The extent of income-testing, however, is not a comprehensive indicator of the redistributive profile of social security systems, as it is possible to redistribute between rich and poor through means other than explicit income-tests. For example, all OECD countries have safety nets to prevent old-age poverty, but there include social assistance schemes, separate, targeted retirement income programmes, basic pensions, and minimum pensions within earnings-related plans. While not as progressive as income-tested benefits, universal payments can be highly redistributive.
Figure 3 compares the share of spending on cash benefits that goes to the poorest quintile (20 per cent) of households with the share of spending that goes to the richest 20 per cent.
Figure 3: Percentage of public social benefits in cash paid to the lowest and highest quintiles, total population, OECD countries, 2011
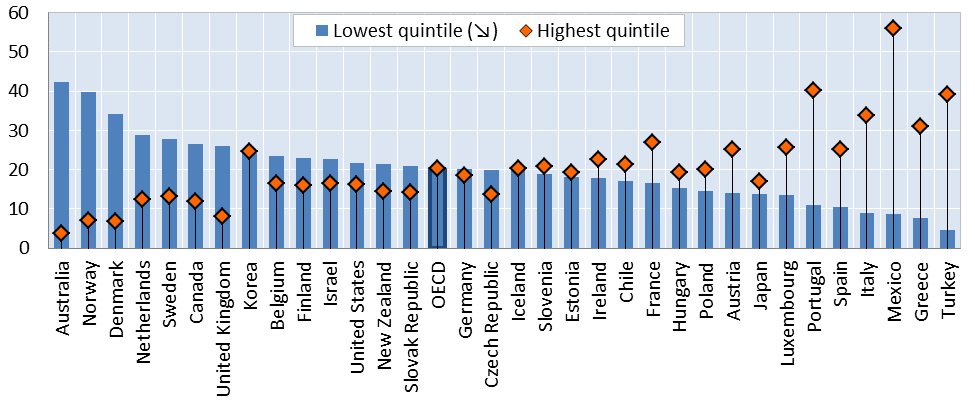
Source: OECD 2014.
Australia has both the highest share of benefits going to the bottom quintile and the lowest share going to the richest quintile. It is notable, however that countries similar to Australia include Norway, Denmark, the Netherlands and Sweden, which all channel a higher percentage of their spending to the poor than the United States, for example. The countries at the other end of the spectrum include Mexico and Turkey, as well as Greece, Italy and Spain.
From Figure 3 it is possible to calculate an index of progressivity – the ratio of transfers paid to the poorest 20 per cent to those paid to the richest 20 per cent, shown in Figure 4. Australia stands out –paying the poorest 20 per cent more than 11 times as much as the richest 20 per cent, a figure 11 times the OECD average.
While Australia has the most progressive transfer system in the OECD, it does not necessarily follow that it has the most redistributive system. As pointed out by Nicholas Barr (1992) the degree of redistribution depends on both the progressivity of benefits and the level of spending. By definition, in a means-tested system, benefits provided to the poorest are greater than average benefits paid, a universal, flat-rate system provides benefits that are of equal value to all recipients, while under an earnings-related system average benefits are greater than minimum benefits. Thus, for a given amount of spending, benefits paid to those with fewer economic resources will be greater under a means-tested system than under a universal benefit system, which in turn will provide more generous payments to the poor than an earnings-related system.
It is also important to remember that even apparently unprogressive transfer systems can reduce inequality so long as they give low-income groups a share of spending that is higher than their share of private income.
Figure 4: Ratio of transfers: cash benefits paid to poorest 20% of population relative to benefits paid to the richest 20%, OECD countries, 2011
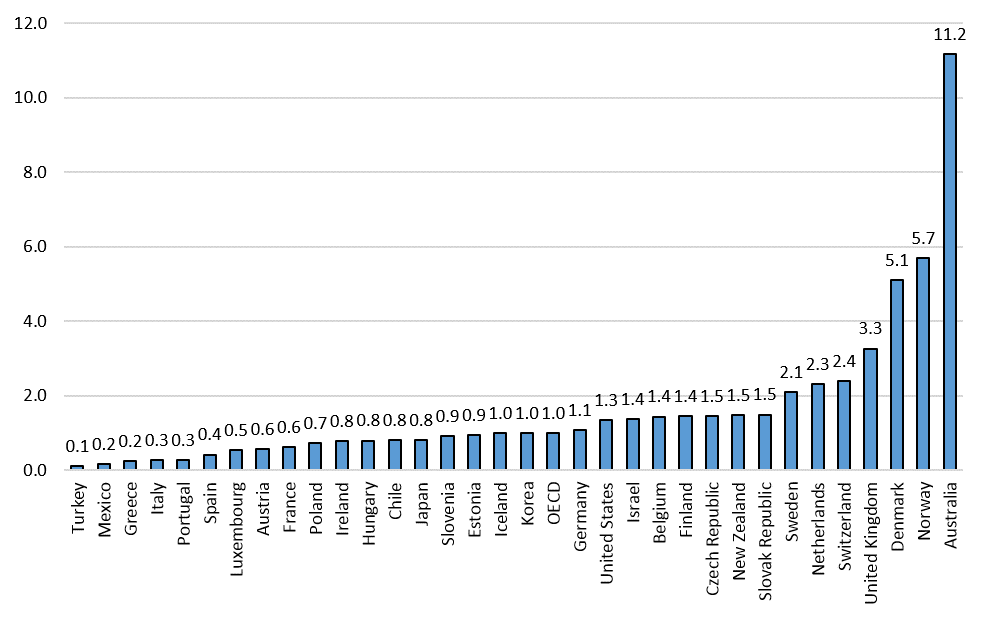
Source: Authors calculations based on OECD 2014.
On the other hand, these characteristics of welfare systems may also reduce the overall size of spending, as the middle class may be more supportive of generous welfare programmes when benefits are universally provided (Korpi and Palme, 1998). Indeed, in much of the social policy literature, Australia (along with the other English-speaking countries) is viewed as particularly ungenerous: “Australia has no collective social insurance schemes and is thus a textbook example of a liberal or residual system” (Schut, Vrooman and de Beer, 2001, p. 26).
The critical question, therefore, relates to the impact of different programme designs when levels of spending and taxes differ across countries, the topic of my next article.


Thanks Peter. On most of these charts, Australia stands out as a clear outlier. This leads to two natural questions. First, is Australia truly unique in this space, or are the charts partially a result of the peculiarities of compiling data across countries (comparing the Australian superannuation and pension system with social security systems is one possible reason that such comparisons are tricky).
Second, if we are an outlier, is this a good thing. Having a highly targeted welfare system sounds like a good thing, but it also results in high effective marginal tax rates as transfers are withdrawn. Why have 33 other OECD countries chosen to have a less targeted transfer system?
Peter
Thanks. There are always complexities of comparisons, but 16 other OECD countries also have mandatory or quasi mandatory private/occupational pensions, many of them high spenders (Nordics and the Netherlands), so ranking might change, but we would still likely to be very targeted. We were before we had superannuation, as well.
We do get high EMTRs from overlaps, but other countries also have higher direct and indirect tax rates. There is also an implicit EMTR in contributory systems that are also categorical – for example if you work over a few hours a week in many countries you become completely ineligible for unemployment insurance,
Australia actually has lower than average EMTRS for people moving from welfare to part-time work than most other OECD countries (apart from those who have extremely low or non-existent welfare systems.
The answer to your third question: accidents of history!
Pingback: Plan for common fundamental earnings ignores the worth of labor – My Blog