

In Part 1, I examined the fiscal cost of indexing Australia’s personal income tax thresholds to inflation. In Part 2, I discuss its distributional impact.
Findings: distributional impact
Figure 1 shows how the resulting tax savings over 10 years are distributed across all personal income tax filers ranked by taxable income expressed in 2025 dollars per year (from zero to $200,000 and over).
Figure 1: Share of tax cut by income from 2024-25 to 2034-35 (percentage of total tax savings)
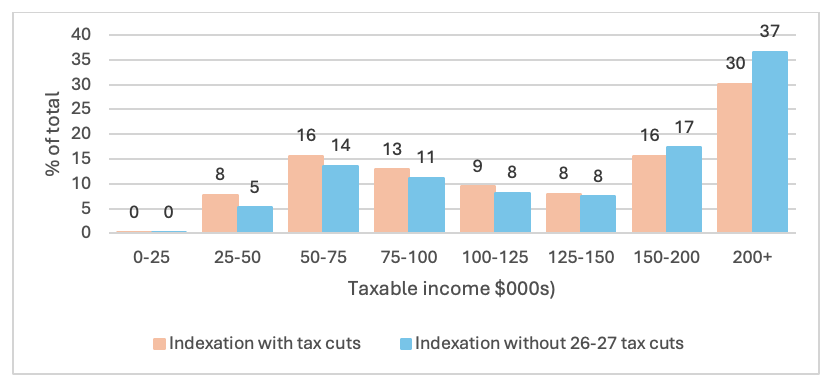
Source: PBO (2025), Build Your Own Budget (2025-26 Budget version and 2024 MYEFO version).
Again, not all individuals have records with the Australian Taxation Office. Overall, the vast majority of the lowest 30% of households ranked by gross household income do not pay income tax and do not benefit from income tax cuts. Most receive income support payments such as the Age Pension. Therefore, their impact is usually regressive.
The yellow bars show how the proceeds of a combination of indexation of tax thresholds and the tax cuts legislated to start in 2026 are shared. The blue bars show the distribution of the proceeds of indexation of tax thresholds without those Labor tax cuts (the ‘pure’ indexation effect).
Figure 2 shows how the resulting tax savings are distributed across all personal income tax filers ranked by percentiles of annual taxable income (from the lowest 20% to highest 20%, up to the highest 5%).
Figure 2: Share of tax cut by percentile of income from 2024-25 to 2034-35 (percentage of total tax savings)
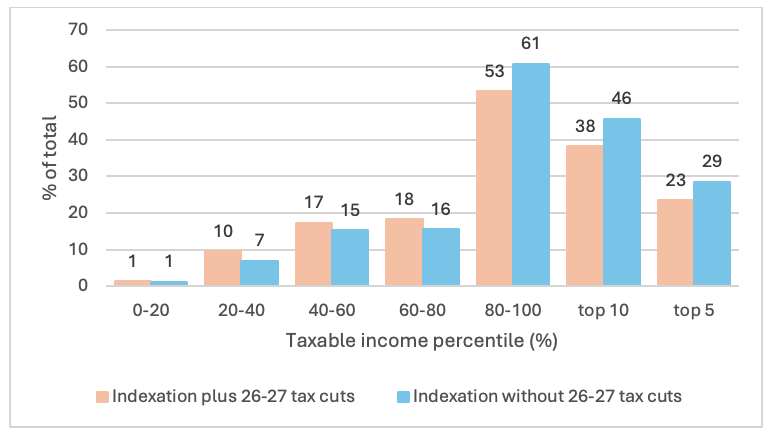
Source: PBO (2025), Build Your Own Budget (2025-26 Budget version and 2024 MYEFO version).
When we include the impact of the Labor tax cuts, the resulting tax reductions would be skewed towards the highest 20% of personal income tax filers:
- Individuals with annual incomes over $125,000 in 2024-25 dollars (around the highest 20% of tax filers) would receive over half (54%) of the resulting tax cuts;
- Those on $75-$125,000 (around 30% of all tax filers) would receive approximately one fifth (22%);
- Those on $75,000 or less (around half of all tax filers) would receive approximately one quarter (24%).
Without the 2026 and 2027 tax cuts, the benefits of indexation would be more skewed towards people on high incomes. That is, the Labor tax cuts (lowering the first tax rate from 16% to 14%) are a less precise but more progressive response to bracket creep than indexing the tax thresholds.
If we subtract the 2026 and 2027 tax cuts from the overall tax cuts arising from indexation from 2024 to 2034:
- the highest 20% of personal income tax filers with annual incomes over around $125,000 (in 2024-25 dollars) would secure 61% of the overall benefits from tax indexation;
- Those on $75-$125,000 (around 30% of all tax filers) receive one fifth (20%);
- Those on $75,000 or less (around half of all tax filers) receive the remaining one fifth (20)%.
Distributional impact by gender
Figure 3 shows that at least 60% of tax reductions flowing from indexation of the tax thresholds would go to men, and only 40% to women. If the Labor tax cuts are excluded from the analysis, the share going to men increases to 62%
Figure 3: Share of tax cuts by gender from 2024-25 to 2034-35 (%)
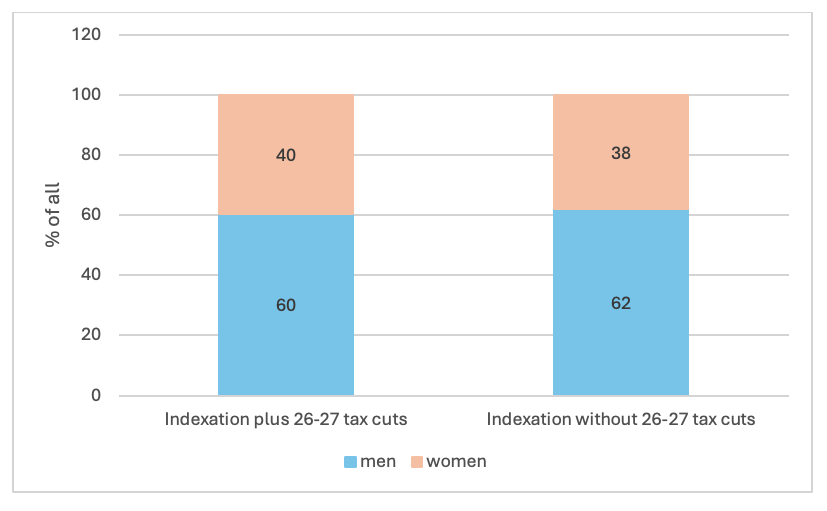
Source: PBO (2025), Build Your Own Budget (2025-26 Budget version and 2024 MYEFO version).
Policy implications
The cost of indexing income tax thresholds together with the fact that most of the benefit goes to people with high incomes raises concerns around budget sustainability and the likely impact on income inequality.
In the absence of accompanying tax reforms that raise revenue very substantially, indexation of tax thresholds would either substantially increase the budget deficit or lead to substantial cuts in public expenditure. Advocates of smaller government favour automated tax cuts as part of a strategy to “starve the spending beast”.
It would be challenging for any government to undertake tax reforms that raise sufficient revenue to pay for tax indexation. The outcome would likely be a combination of spending cuts and a higher deficit. Since people on the lowest incomes disproportionately rely on publicly funded benefits and services and any benefit they receive from tax indexation would be relatively small, they are likely to be adversely impacted. On the whole, indexation of income tax thresholds without major tax reforms to offset their cost would be regressive, even though some wage-earners with low incomes may benefit overall.
A realistic assessment of the impact of indexation should compare the impact of indexation with that of the discretionary tax cuts for which it is a substitute.
Analysis by the E61 Institute of a decade of tax cuts from 2012 to 2022 indicates that the overall impact of those tax cuts was progressive (at least in terms of its distributional impact on tax filers). That is, average tax rates rose the most for individuals with high incomes. The average tax rate for the highest 25% ranked by taxable income rose by 1.5 to 3.5 percentage points compared with around 1 percentage point for the middle 50%. The average tax rate declined by 0.5% for those in the lowest 10% and rose by up to 1% among the lowest 25%.
The outcome would not have been as ‘progressive’ if this analysis extended to 2024 and the Coalition government’s Stage 3 tax cuts were implemented as planned (especially the proposed extension of a 30% tax rate up to an income of $200,000). The main implication from the E61 analysis is that discretionary tax cuts leave more room for governments to change the distributional impact of taxation, for better or for worse.
The combination of bracket creep and discretionary tax cuts is not ideal, but arguably better than the alternative.
This two-part series is related to a project undertaken by the Australian Council of Social Service (ACOSS).


Recent Comments