
The consumption of sugar and its adverse health outcomes are seldom out of the news.
It is known that over-consumption of sugar is associated with obesity, type 2 diabetes, tooth decay, cancer, and cardio-vascular problems. It is also known that the levels of sugar consumption in Australia far exceed the guidelines on consumption produced by the World Health Organisation (WHO).
In order to reduce the harmful effects of this over-consumption on health, health professionals have concluded that something needs to be done to reduce sugar consumption per head. A tax on sugar is their preferred form of policy intervention, yet it remains a controversial policy instrument amongst Australian politicians, amongst beverage manufacturers and amongst economists.
As a guide to policy formation, we review the empirical studies in Australia of sugar taxation.
A (not so) sweet problem
The WHO has recommended that adults reduce their sugar consumption to less than six teaspoons a day.
Currently, in Australia average consumption per head is 15 teaspoons a day, of which eight are consumed in sugar-sweetened beverages (SSBs). Amongst the adult population, 52 per cent exceed the guidelines and amongst 9 to 18 year-olds, the corresponding figure is almost three-quarters. It is against this background that a tax has been proposed as a way to reduce consumption.
A reduction in consumption may be seen as goal in itself, without any attempt to optimise that reduction based on some criterion. Alternative criteria include weight loss per person, a reduction in litres of SSBs consumed, savings in disability-adjusted life years, correction of the internality created by over-consumption (that is, where individuals ignore, or are not aware of, the costs to themselves of the subsequent poor health caused by over-consumption), or the possibility that sugar is an addictive substance, which has important implications when considering the consumption of sugar by children.
Over-consumption of sugar leads to a market failure. This failure arises because consumers do not consider the long-term effects on their health. Such behaviour may occur because they do not have sufficient information on the sugar content of the foods and drinks that they consume and, if they did, they might reduce their consumption; they may not be aware of the long-term health effects; and it may be that sugar is an addictive substance and one over which they lack the necessary self-control.
An economist’s standard response to this public policy issue is to propose a Pigovian tax, which will cause consumers of sugar to internalise the externality of excess sugar consumption and to reduce their consumption. The choice of the tax rate is based ideally on a calculation of the net benefits from reducing the external costs, less the loss of consumer surplus, plus the loss of producer surplus or firms’ profits, plus the fiscal effects of the tax.
But, what to tax? And, what rate?
A number of issues complicate the analysis of the socially-optimal tax rate for sugar taxes. First, ‘sugar’ needs to be defined, as well as the subset of food and drink products that contain it. Second, there is heterogeneity of consumers with respect to their level of consumption and with respect to their responsiveness to a price change. Third, the effect of a given tax on the consumer price, and thereby on consumption, depends on the market structure in which the tax is imposed.
In particular, if that structure contains firms which are imperfectly competitive, which seems probable at the manufacturing and retail stages of food products and drinks, then the pass-through and pass-back effects of the tax will differ from those under perfect competition along the supply chain. For example, it is known that under certain imperfectly competitive market structures, the pass-through effects of an excise tax when applied to manufacturing firms leads to the consumer price increasing by more than 100 per cent of the tax.
Estimation of the price elasticities of demand – which are necessary in order to calculate the reduction in quantity consumed for a given tax-induced increase in price – requires data. In Australia, two sources have been used: a one-off survey undertaken by the ABS, and AC Nielsen scanner data. In the case of sales and consumption of SSBs, the latter source of data underestimates total consumption because only about one half of SSBs purchased are scanned, the remainder being purchased in restaurants, fast food outlets and vending machines. Using scanner data, Sharma et al. (2014) estimated the price elasticity of demand for regular SSBs to be -0.63, with positive cross-price elasticities for alternative drinks such as diet soft drinks, fruit juice and cordials.
With heterogeneous consumers and imperfect competition in the supply chain, three additional matters need to be resolved in choosing a tax on sugar. The first is the type of tax to introduce (for instance, an ad valorem tax based on the value of the purchase or a specific tax based on the quantity purchased), the second is the number of tax rates to be used given heterogeneity of consumers (for example, higher consumption should be matched with a higher tax rate), and the third is the point in the supply chain at which the tax is imposed (on consumers or manufacturers or sugar growers).
UK experience: taxation based on the sugar content
The choice of the type of tax depends somewhat on the objective of the tax. Taking that objective as reducing the consumption of sugar, it has been found both in theory and empirically that the best form of tax is a specific tax imposed on the sugar content of the SSB.
To illustrate, in 2018 the government of the UK introduced a progressive excise tax on manufacturers of SSBs, which had two values that were based on the sugar content of their branded SSBs. The response of manufacturers, having been given a two-year warning of the introduction, was to reduce the sugar content of most SSBs in order to reduce their tax burden. The effect has been that consumers can continue to consume their favourite brand and, for most brands, this would have reduced their sugar consumption even if it did not appreciably reduce the number of litres consumed.
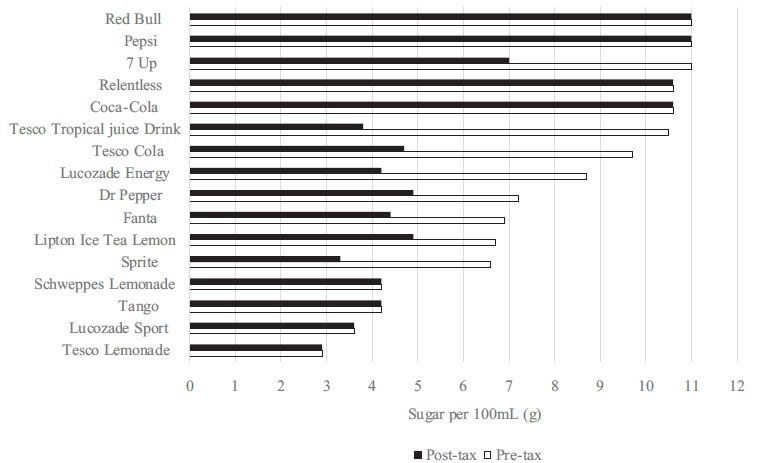
Figure 1. The response of manufacturers of sugar-sweetened-beverages in the United Kingdom
Yet, the effect…
In a study undertaken in Australia by the Grattan Institute, the simulated effects of alternative tax regimes were calculated. The tax amounts chosen were 30 cents or 40 cents per litre of SSB, as well as a tax regime similar to that introduced in the UK with a tax of 20 c/L for drinks with a sugar content of less than 8 g/100 mL, and a tax of 40 c/L for a sugar content of more than 8 g/100 mL. To put the 8 g/100 mL in context, the SSBs sold in Australia have sugar contents that range between 8.6 g/100 mL and 11.5 g/100 mL.
The Grattan Institute study found that the reductions in consumption were 7 litres, 10 litres and 9 litres per person per year, respectively. A reduction of 10 litres per person per year represents a reduction in aggregate Australian consumption of 15 per cent and in obesity of 2 per cent. In another study, Veerman et al. (2016) found similar outcomes for a 20 per cent ad valorem consumer tax. It reduced average consumption of SSBs by 12.6 per cent, and obesity by 2.7 per cent for males and 1.2 per cent for females.
One conclusion from both studies is that, if the objective of introducing the tax is to reduce obesity, then the effect at these typical rates is rather trivial. There are of course other health outcomes for which these rates might be effective. However, compared with the tax rates of 211 per cent, 117 per cent and 145 per cent imposed on spirits, beer, and cigarettes, respectively, the choice of a 20 per cent tax on sugar in SSBs seems far too small. Some economists would describe it as nuisance tax.
As well as the efficacy aspect of the design of the tax, there is the equity dimension. The latter has been used as an argument against a sugar tax. While it is true that a tax on SSBs would fall disproportionately on those households with lower incomes, these are also the households which have a higher incidence of diet-related poor health and, therefore, the households which would benefit most from a tax-induced reduction in consumption of SSBs. Moreover, even amongst these households, the percentage of disposable income that is spent on SSBs is less than 1 per cent.
A two-tiered solution
Given the multiple reasons for a market failure due to excess sugar consumption, any tax will need to be complemented with other instruments which will alter consumption behaviour. For example, better product labelling could provide more information on sugar content, and education campaigns could alert consumers to the health risk of heavy consumption of sugar, as well as to the long-term consequences of possible addiction.
We were not able to find that the net benefits of introducing a tax are positive because of gaps in the data required. Nevertheless, given the likelihood of a positive net benefit from a tax, and the benefits of a tax as a signalling device for consumers, we conclude that a tax on sugar-sweetened beverages is desirable.
Because of the heterogeneity of consumers, we recommend the introduction of a two-tier tax on SSBs. The tax rates in Australia that correspond to the rates in the UK would be 0 cents/L for a sugar content of less than 5 g/100 mL, 33 cents/L for a sugar content of more than 5 g/100 mL but less than 8 g/100 mL, and 44 cents/L for a sugar content of more than 8 g/100 mL. We recommend these as the initial tax rates, which can be adjusted subsequently in the light of evidence relating to the effectiveness of the tax and its costs.
Our recommendation of sugar tax is not a radical proposal. More than twenty countries have already introduced a tax on sugar or sugary products.
Further reading: Lloyd, P. J. and MacLaren, D. 2019, ‘Should We Tax Sugar and if so How?‘, Australian Economic Review, 52(1) pp. 19-40.


Recent Comments