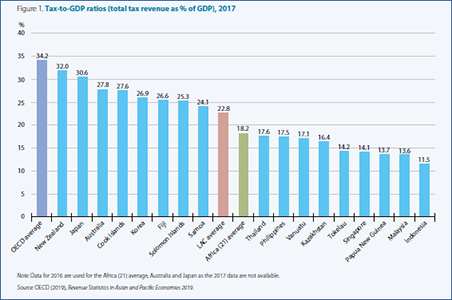
Tax-to-GDP ratios increased in the majority of Asian and Pacific economies covered by a new OECD report published yesterday. Nine of the economies in the publication increased their tax-to-GDP ratios between 2016 and 2017, compared with only three in the preceding year, according to Revenue Statistics in Asian and Pacific Economies 2019.
This sixth edition of Revenue Statistics in Asian and Pacific Economies covers 17 countries, including Vanuatu for the first time. Tax-to-GDP ratios across these countries varied considerably, ranging from 11.5% in Indonesia to 32.0% in New Zealand. In general, tax-to-GDP ratios were higher in the Pacific economies than in the Asian economies: Pacific economies had tax-to-GDP ratios higher than 24%, with the exceptions of Tokelau (14.2%) and Vanuatu (17.1%), while the Asian economies reported tax-to-GDP ratios below 18%, with the exceptions of Korea (26.9%) and Japan (30.6%, 2016 figure).
The increased revenue collection of most countries in 2017 was largely driven by economic factors rather than changes in tax policy or administration. These factors included higher revenues from oil production in Kazakhstan, the growth of the logging sector in the Solomon Islands and Vanuatu’s recovery from Cyclone Pam in 2015. Meanwhile, a fall in revenues from corporate income tax (CIT) and value added tax (VAT) resulting from an economic slowdown explained the decline in Papua New Guinea’s tax-to-GDP ratio. Over a longer timeframe, 11 of the 17 economies in the publication increased their tax-to-GDP ratios between 2007 and 2017, with the exception of Australia, Indonesia, Kazakhstan, Papua New Guinea, New Zealand and Vanuatu.
This publication also includes data on non-tax revenues for five Pacific economies (the Cook Islands, Papua New Guinea, Samoa, Tokelau and Vanuatu). These revenues, which include mainly grants, resource income (including fishing and mining) and other fees, were equivalent to at least 6% of GDP in the Cook Islands, Tokelau and Vanuatu. Grants exceeded 30% of total non-tax revenues in all five countries and were the main source of non-tax revenues for the Cook Islands (65.7%), Papua New Guinea (59.9%), Samoa (51.1%) and Vanuatu (52.2%).
The report is a joint publication of the OECD Centre for Tax Policy and Administration and the OECD Development Centre with the co-operation of the Asian Development Bank (ADB), the Pacific Islands Tax Administrators Association (PITAA) and the Pacific Community (SPC) and the financial support of the European Union.
Revenue Statistics in Asian and Pacific Economies 2019 includes a special feature exploring the operations of tax administrations in the region produced in collaboration with the ADB.
Key findings
Tax revenues as a percentage of GDP
- In 2017, tax-to-GDP ratios varied across the 17 economies, from 11.5% in Indonesia to 32.0% in New Zealand. Tax-to-GDP ratios in all Asian and Pacific economies in the publication were lower than the OECD average tax-to-GDP ratio of 34.2%.
- Eight of the economies had tax-to-GDP ratios above the Latin American and the Caribbean (LAC) average of 22.8%.
- Five countries (Fiji, Kazakhstan, Singapore, Solomon Islands and Vanuatu,) experienced increases larger than 1.0 percentage point between 2016 and 2017 while Malaysia and Papua New Guinea experienced the largest decreases (0.7 percentage points in both cases).
- Over the last decade, tax-to-GDP ratios increased in 11 countries in this publication and declined in six. The highest increases were observed in Fiji and the Solomon Islands (4.4 and 4.5 percentage points, respectively) while the largest declines were registered in Kazakhstan and Papua New Guinea (9.7 and 7.0 percentage points, respectively).

Tax structure
- In nine economies in this publication, taxes on goods and services accounted for the largest share of tax revenues in 2017. Within goods and services, VAT is an important and increasing source of revenues in most Asian and Pacific economies.
- Income taxes provided the main share of tax revenues in the eight remaining countries with the exception of Japan, where social security contributions (40.4% of total tax revenue, 2016 figure) represented the largest source.
- The tax structure of Asian economies tends to differ from that of Pacific economies:
- VAT accounted for at least 25% of total tax revenue in the Pacific economies with the exception of Australia and Papua New Guinea, but less than 25% in the Asian economies, except Indonesia.
- Revenues from CIT were higher than revenues from personal income tax (PIT) in most Asian economies, with the exception of Japan and Korea; whereas the reverse is true in the Pacific, except in Fiji.
- Revenues from VAT ranged from 12.9% of total tax revenue in Australia (2016 figure) to 44.4% in the Cook Islands (the Solomon Islands and Tokelau do not impose VAT) and was higher as a share of total taxes in the Pacific compared to Asian economies.
- Across all economies with the exception of Tokelau (which does not impose CIT) and Vanuatu (which does not impose income taxes), revenues from CIT ranged from 9.1% of total tax revenue in Samoa to 41.5% in Malaysia.
To access the report and data, visit: http://oe.cd/revenue-statistics-in-asia-and-pacific
(Source: OECD Tax)


Recent Comments