

Goods and Services Tax (GST) reform options, in the form of widening the base, lifting the rate, and reducing exemptions, have recently returned to prominence in Australia’s tax policy debate, particularly with the release of the Commonwealth Government’s 2015 Tax Discussion Paper. This is after a long period in which GST reform was off the political agenda (Freebairn 2011). Subsequent calls to raise the GST rate have been made by a number of state government premiers and the Australian Institute of Company Directors.
The attractions of the GST as a potential source of additional revenue are clear: the tax base is large, and the distorting effects of the tax are believed to be low (see, for example, Charlet & Owens 2010). And the current rate, at 10%, is low by international standards (the OECD average is 19.2%, Australian Government 2015).
While there is no constitutional impediment to the Commonwealth Government unilaterally changing the GST (Boccabella & Bain 2015), the major political parties continue to support the tenet of the original GST agreement that change requires unanimous state and territory approval. This position was explicit in the Tax Discussion Paper, which noted “the Australian Government will not support changes to the GST without a broad political consensus for change, including agreement by all state and territory governments.” One input to state and territory government deliberation on whether they should support GST change is likely to be the analysis of the economic consequences for their state or territory.
Our research, published in a Centre of Policy Studies’ working paper, investigated the potential for GST change to differentially affect state economies. The research uses VURM, a bottom-up multi-regional model, which explicitly models the details of economic activity within each state and territory, and the economic linkages between them. The version of the model used for this research carries detailed modelling of the legislated complexity of the GST: differentiated tax rates, legal exemptions, refund rates, registration rates, export taxation and the low value import threshold. As a result, the model captures the incidence of GST on all users of goods and services, not just households. For example:
- Most industries pay some GST on their production and investment inputs. This arises from diffuse low levels of non-registration for GST purposes (unregistered business cannot reclaim GST paid on inputs) and from input taxation of banking, finance and elements of insurance (these industries do not charge GST on their sales, and cannot claim refunds on GST paid on their inputs).
- Exports should be taxed at a zero rate but in practice not all exports are treated so. In particular, GST is collected on commodities purchased locally by non-residents such as foreign tourists and students. A refund for GST under the Tourist Refund Scheme can only be claimed for a small subset of goods purchased locally by non-residents and many visitors who can reclaim GST do not do so. This creates taxation of export tourism.
These departures from a pure or ideal GST system are important for understanding the impact of GST changes at both the national and regional levels.
The simulation
Our simulation investigates how the raising of a given amount of GST revenue affects the distribution of economic activity across Australia’s states and territories. This is important because perceptions that the GST affects individual states in different ways could impede achievement of unanimous support for GST reform. To examine this, we simulate the effect of increasing the standard GST rate from 10% to 11%. For expository purposes, VURM’s eight regions were aggregated to two: Australia’s largest state, New South Wales (NSW) and the rest of Australia (RoA). In the simulation, we have assumed that:
- Regional labour markets are characterized by short-run stickiness of the real wage with endogenous regional unemployment rates, transitioning to a long-run environment in which regional real wages are endogenous and regional unemployment rates return to baseline.[1]
- Capital, investment, and rates of return are specific to each regional industry. Capital stocks are sticky in the short-run, but adjust gradually in response to changes in investment, which in turn are guided by movements in rates of return.
- Inter-regional migration rates are sticky in the short-run, but adjust gradually to ensure that inter-regional relativities in regional per capital real disposable income return to baseline.
- The federal public sector borrowing requirement follows its baseline path throughout the simulation, via endogenous adjustment of a national lump sum household tax.
- State-specific public sector borrowing requirements are exogenously held on their baseline paths throughout the simulation, via endogenous adjustment of lump sum taxes on households within each state.
- The additional GST raised by the federal government is allocated to state governments on an equal per capita basis.
- The ratio of the balance of trade to Gross Domestic Product (GDP) is exogenously held on its baseline path via movements in the economy-wide average propensity to consume.
- Values for real public consumption spending by federal and state governments are exogenously held on their baseline paths over the simulation period.
Results
Figure 1 reports deviations from baseline in regional and national GDP arising from a one percentage point increase in the standard GST rate. Two effects are immediately clear: (i) the path for real GDP exhibits a pattern of trough and gradual recovery (albeit to a level permanently below baseline); (ii) NSW is adversely affected relative to the rest of Australia.
The first effect is largely caused by some of the additional GST falling on inputs to production and investment. In the short-run, with real wages sticky, the effect of additional production taxation is to raise the real producer wage, causing employment to fall. This accounts for the initial trough in real GDP. However, wage flexibility removes this effect in the long-run. This explains the path of gradual recovery in GDP.
But, with some GST falling on investment inputs (due to non-registration and input taxation of banking and finance), the long-run capital stock is lower than it would otherwise be. This largely accounts for the negative long-run GDP deviation. An additional factor permanently damping the long-run GDP deviation is an increase in allocative efficiency losses arising from raising the standard GST rate by 1 percentage point while leaving unchanged rates on all zero-rated items (like basic foods).
Figure 1: Impact on regional and national real GDP (at market prices) of a 1% point increase in the standard rate of GST (% deviation from baseline)
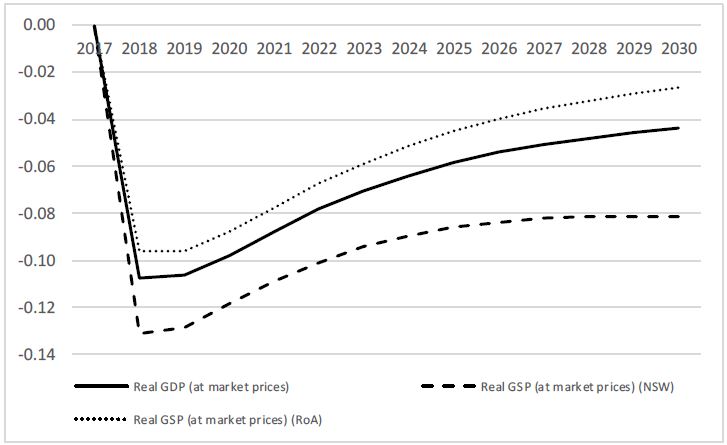
There are four main reasons why NSW is adversely affected relative to the rest of Australia. First, input-taxed industries, in particular banking, finance, and elements of insurance, constitute a higher proportion of activity in NSW than in the rest of Australia. This reflects NSW’s status as a financial centre. These input-taxed industries cannot claim GST paid on their inputs to production and investment, hence the rise in the GST rate raises production and investment costs in NSW relative to the rest of Australia.
Second, insurance, banking and financial services are themselves important intermediate inputs in current production, and the input-taxation of production of these commodities leads to some indirect tax cascading. This effect is more important in NSW than in the rest of Australia because inputs of banking, finance and insurance are a higher share of production costs in NSW.
Third, a rise in the GST rate translates to a rise in export taxation to the extent that it falls upon commodities purchased on-shore by international visitors, and to the extent that the GST collected in this way is not refunded upon departure. This will matter more for regions where servicing foreign tourists and students are important activities (like NSW), than regions where, say, mining and agriculture are important. Our model shows that the proportion of NSW exports that is subject to non-refunded GST is 16.2%, whereas for the rest of Australia it is 12.2%. Hence NSW exports are more adversely affected by the rise in the GST rate.
Finally, NSW receives less back in GST revenue from the Commonwealth than what it contributes. Government budget data show NSW received about 31% of total GST revenue in 2014-15, whereas our model calculates it contributed over 33% of total GST revenue in the same year – this largely reflects NSW’s higher share of national consumption spending (33.8%) relative to population (31.8%) in the VURM model database.
Our analysis shows that even a small straightforward change in the GST rate has consequences for the distribution of economic activity across Australia’s states and territories. More complex changes, involving broadening the base and changing exemptions, are likewise likely to cause changes in relative economic activity across states and territories. While our model is non-linear, results for a bigger increase in the GST rate, say to 15%, will have impacts approximately five times larger than those reported here. Under the current arrangements requiring unanimous support for GST change, consideration of such impacts will need to inform inter-governmental deliberations on GST reform proposals.
[1] In formulating short-run wage demands, we assume workers understand they will be compensated for changes in the GST via lump sum transfer. Hence the real wage measure that is sticky in the short-run is defined as the nominal wage deflated by the Consumer Price Index (CPI) evaluated at prices excluding GST.


Recent Comments