

There is little agreement about whether inequality in Australia has increased or declined in recent years. Some experts argue that the level of inequality in Australia has remained stable in recent years, while other studies point to worsening inequality. This may reflect the complexity of measuring inequality, and the fact that attempts to do so use different data sources, which could also yield diverging patterns.
Nevertheless, household survey data such as the Household, Income and Labour Dynamics in Australia (HILDA) and the Survey of Income and Housing show that Australia remains one of the nations in the industrialized world with the lowest levels of total inequality. This is true regardless of whether inequality is measured in terms of wages, earnings, disposable household income, before or after taxes.
But total inequality is not an infallible metric when we are trying to know how fair a society is. Take for instance inequality that arises because some people work harder than others, finding themselves able to accumulate more resources. Social scientists argue (and perhaps many people would also agree) that the inequality arising from differences in individual effort is ‘fair’. On the other hand, inequalities arising from circumstances (over which people have no control, such as country of birth, gender, family background) or blind luck (which is also out of people’s control, but differs from circumstances in meaning sudden or unanticipated shocks) are not fair.
However, distinguishing effort from circumstances is difficult. Previous research tells us that from very early on differences in circumstances and luck matter. For instance, a healthy, white, male baby born to loving parents living comfortably in a major Australian city has already won a number of life’s lotteries. The early and ongoing entanglement of circumstance and luck in our lives means that distinguishing unfair inequality (inequality of opportunity or circumstance) from inequality of effort is far from easy.
Conventional metrics of inequality such as the Gini coefficient, which is usually calculated on the basis of total inequality, do not differentiate between the fair and unfair components of inequality. Nevertheless, there have been attempts to examine the level of fairness of the inequality observed in societies. For example, economic and social mobility or the process of moving up or down the socio-economic ladder over time, is sometimes considered a metric of fairness. Economic and social mobility tend to be high in fair societies and low in societies with high levels of unfair inequality, but measuring economic and social mobility typically requires longitudinal data or retrospective information which may not always be available.
In our study, we suggest a more direct approach of decomposing inequality into its fair and unfair components. We estimate to what extent total inequality can be explained by systematic circumstances and to what extent explained by effort. We measure the contribution of various sources of inequality of opportunities using data from thirteen annual waves (2001–2013) of the HILDA Survey, an Australian longitudinal study that collects social, demographic, economic and employment information on all members of sample households aged 15 and over. We measure outcomes in terms of income and employ various pecuniary measures available in HILDA to examine inequality of opportunities in Australia. We adopt the analytic approach proposed by Ferreira and Gignoux (2011) by identifying various observable factors that can be considered as circumstances, and estimating the contribution of these factors to overall inequality.
Findings
We find that at least 8 percent of Australian total household income inequality before government transfers and taxes reflects personal circumstances associated with unfair inequality (Figure 1). Still, this is the lower limit of unfair income inequality because we only consider gender, country of birth of the respondents and their parents, family socioeconomic background and Indigenous status. We ignore health, disability and age, for instance, as well as more contested factors such as educational attainment—which many also view as a combination of effort and circumstances.
Figure 1. Share of inequality of opportunities to total inequality over time (%), HILDA: 2001-2013
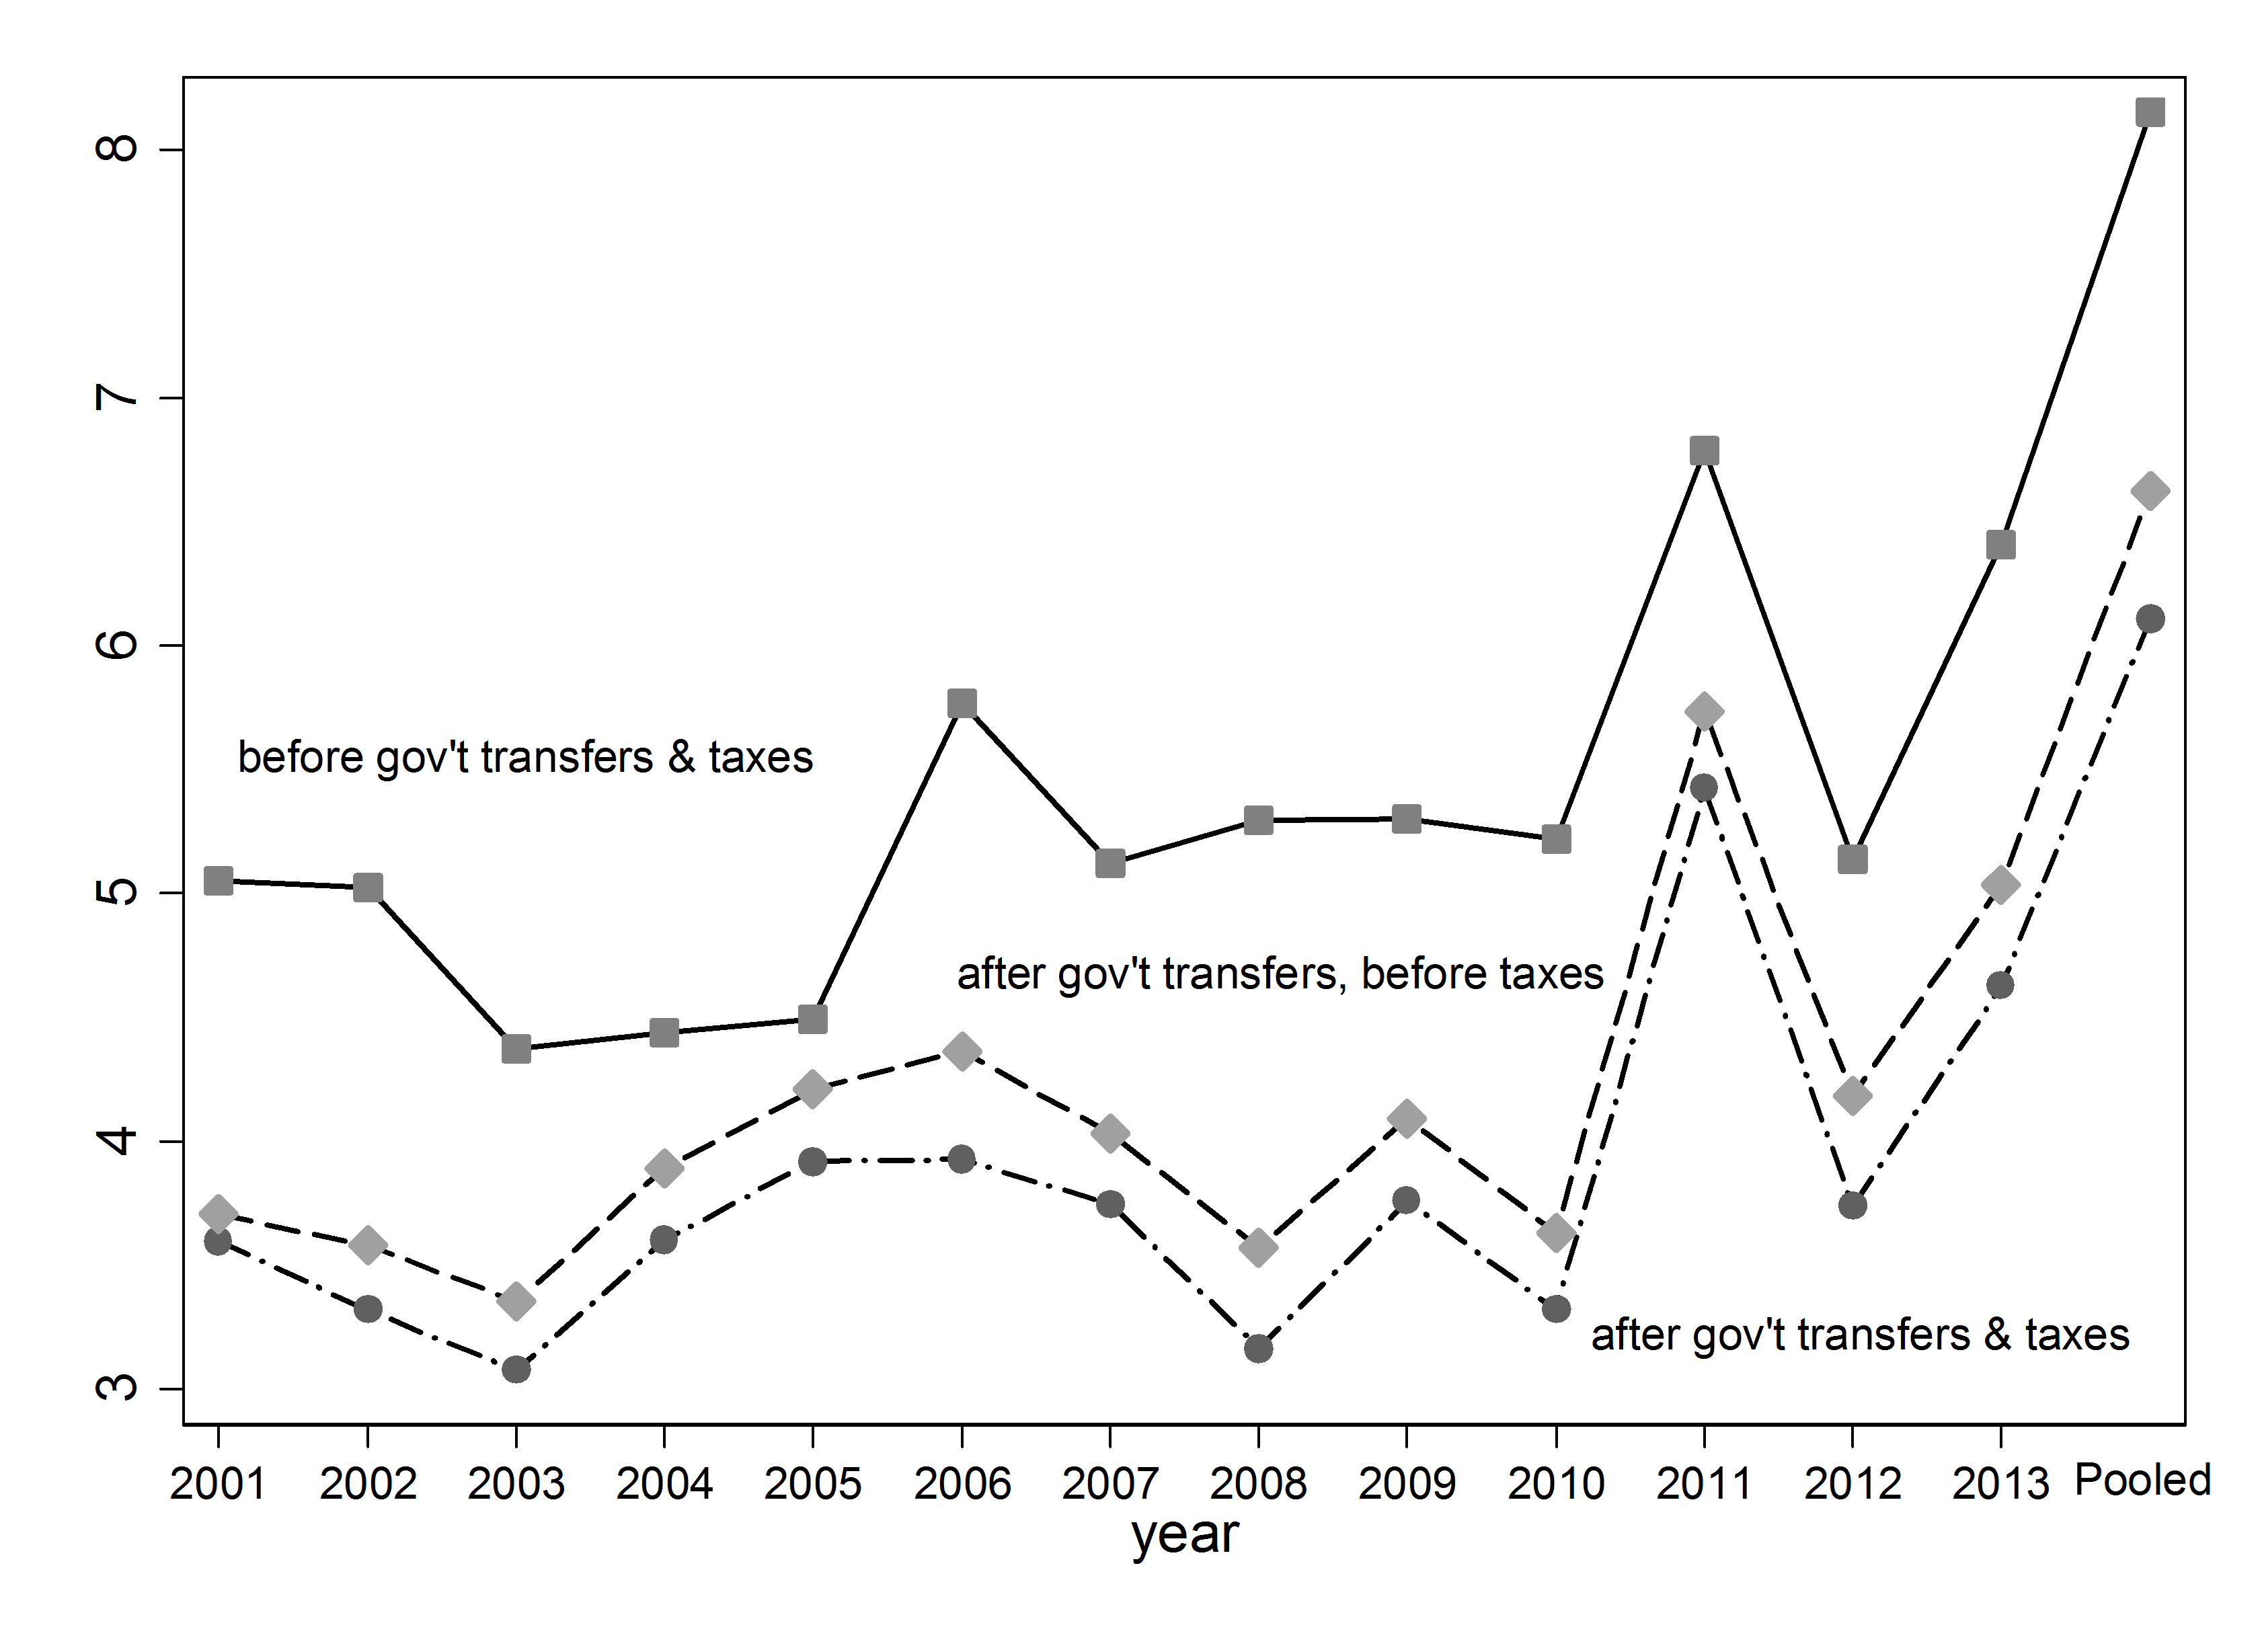
If we include age as a circumstantial source of unfair inequality, the share of inequality of opportunities for Australia rises to 20 percent. This is the second highest estimated share of ‘unfair’ inequality in countries for which published results are available; just a little behind Ireland’s 22 percent. At the other end of the spectrum are the Scandinavian countries, which have consistently low shares of inequality of opportunities regardless of the method used.
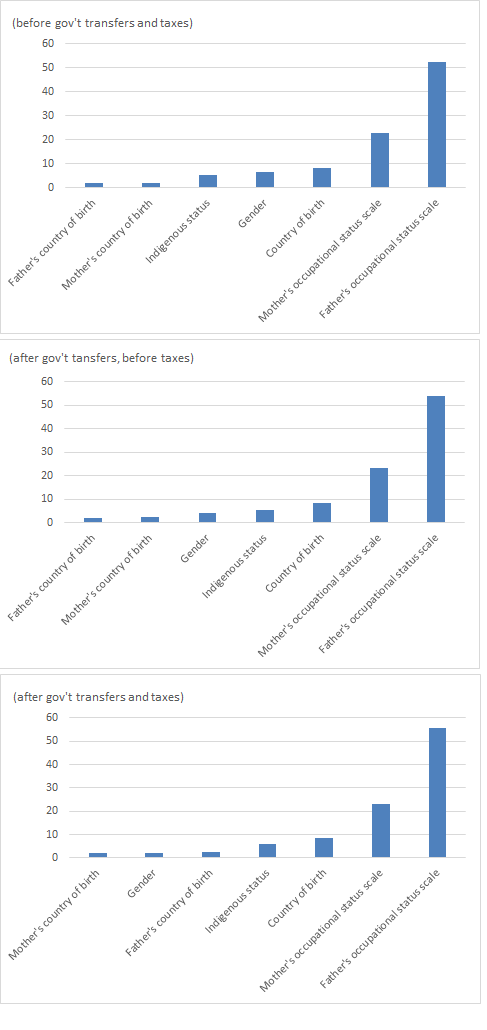
Our study finds that the father’s occupational status is one of the most important circumstantial characteristics for an individual, contributing to more than 50 percent of the observed inequality of opportunities; other parental characteristics contribute a further 25 percent. This finding prompts the need to reinvigorate policies that address unfair outcomes in education or employment, in order to break the cycle of intergenerational transmission of social and economic disadvantage.
Figure 2. Contribution of Individual Circumstances (%), HILDA: 2001-2013
Lessons for Australia’s tax and transfer system
Interestingly, our study finds that government payments seem to be effective in reducing some of the inequality that unfair circumstances create. In particular, income support and family payments reduce the unfair component of inequality by approximately 30 percent before taxes and an additional 29 percent reduction after taxes. Australia is regarded as one of the high income countries with the most targeted welfare systems, and this finding hints at the effectiveness of these systems in reducing unfair inequalities.
In addition to government payments and taxes, a substantial body of research in economics and the social sciences offer various solutions to prevent the proliferation of unfair inequality. These solutions include early interventions, plus ongoing support, with a particular focus on targeting the critical points (or ‘bottlenecks’) over the life course, where people’s opportunities can be particularly constrained by their background and other circumstances beyond their control. Such approaches complement the various payments that Australia’s welfare system provides to address poverty and disadvantage, to create more opportunities and level the playing field for everyone.
There is a global effort to produce accurate, internationally comparable measures of the unfair component of inequality and hopefully, as we accumulate more knowledge on this topic, we can devise more ways to curtail unfair inequality.


Recent Comments