

The subject of inequality is currently receiving more attention from researchers and the media than it has for many years. Paradoxically, the huge increase in media interest in income inequality in New Zealand follows a period of over 20 years during which there has been no trend increase in standard annual income inequality measures. For example, using household data, Ball and Creedy (2016) find that Gini inequality measures of annual income per adult equivalent rose during the late 1980s until the early 1990s, but have been fairly flat since.
How has inequality varied over a much longer period? Comparisons are complicated not only by data limitations. Changes in the tax structure over time, influencing the components that are included in ‘taxable income’ (such as certain benefit payments and ‘fringe benefits’), can have a substantial effect on measured income, and even on the timing of income receipts. Many other changes, such as changes in the composition of the population, may affect annual inequality measures, but may not reflect fundamental inequality changes.
In our recent study, we use several datasets to examine long-term changes in the inequality of individual incomes in New Zealand. Using Statistics New Zealand Official Yearbooks (NZOYB) from the mid-1930s to early 1980s, and Inland Revenue data for 1981-2014, we report Gini indices for various measures of taxable incomes for individuals since 1935. The series is complicated by some missing data during World War II, and definitional changes and omissions in the mid-1970s (for which a ‘provisional income’ series was used).
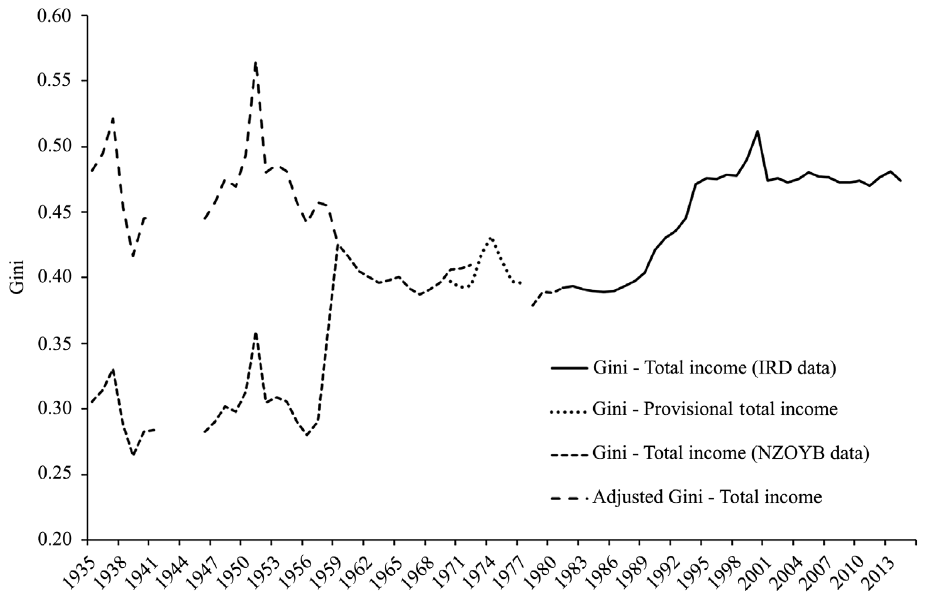
After adjusting Gini coefficients obtained from income data for the pre-1958 period before Pay-as-You-Earn (PAYE) was introduced in New Zealand, we obtain the series of Gini indices for 1935 to 2014 (Figure 1). The introduction of PAYE in 1958 substantially expanded data coverage beyond tax filers-only in the pre-1958 period, with many low-income individuals below the tax-free threshold included in the data after 1958.
Figure 1. Gini measures for all individuals: Total income before tax 1935-2014
Findings
Based on the unadjusted series, inequality appears to be relatively stable from the early 1960s to the late 1980s, except for a short period in the early and mid-1970s, after which it rose to 0.47 in 1994. It is hard to escape the view that this increase was associated with the reforms that took place during the 1980s. Relevant changes included the gradual flattening of the marginal income tax rate structure, with the top marginal rate falling from 66, to 48 and then to 33 per cent, along with benefit reductions and the end to centralised wage setting.
In addition, fringe benefits tax was introduced in 1985 such that, along with the major reductions in the top rate of income tax, the strong incentive to divert income into non-taxable forms prior to the reforms was substantially removed or reduced by those reforms. It might be expected, therefore, that from the mid-1980s, an increasing amount of income of top earners would be recorded in official data that previously may well have been ‘hidden’. This probably contributed to the observed increase in income inequality.
After 1994, the Gini is relatively constant again, except for a spike in the tax year 1999-2000. This spike is associated with the rise in the top marginal rate from 33 per cent to 39 per cent in 2000, which led to income shifting after the announcement of the change. Both periods of relative stability in the Gini measure nevertheless witnessed other substantial changes, for example, in the structure of industry and in labour force participation (particularly of women) and participation in tertiary education.
Once the series is adjusted to allow for the change in data coverage, the ‘adjusted Gini’ series suggests a substantial fall in income inequality during the 1950s from a peak of around 0.57 in 1951, having risen after World War II from 0.45 in 1947. The peak in 1951 coincides with the Korean War, associated with a large effect on commodity – especially wool – prices. Based on the adjusted series, the Gini indices for the period 1935-1941 in Figure 1 suggest some variability in the index around 0.45.
Country comparison
A comparison of New Zealand with Australia yields some interesting insights. Figure 2 includes the annual New Zealand adjusted Gini series and Leigh’s (2005) series for Australia over the period 1942-2001. The Australian Gini coefficients relate to pre-tax incomes for adult males based on data for male taxpayers, together with an adjustment for imputed incomes of non-taxpayers. As a result, the absolute levels of the Gini coefficients are not comparable across the two countries, but it is interesting to compare their trends over time.
The similarity in the long-term pattern of the Gini time-series in the two countries is quite remarkable, notwithstanding very different economic conditions and policies over this extended period. Both countries display the same tendency for inequality to fall during the immediate post-World War II decades, and both subsequently experience an increase in inequality from the 1980s. The New Zealand increase appears somewhat later than in Australia and is more rapid, taking less than a decade, compared with the more steady increase in Australia over two decades from the late 1970s.
Figure 2. Comparison of Australia and New Zealand Gini estimates
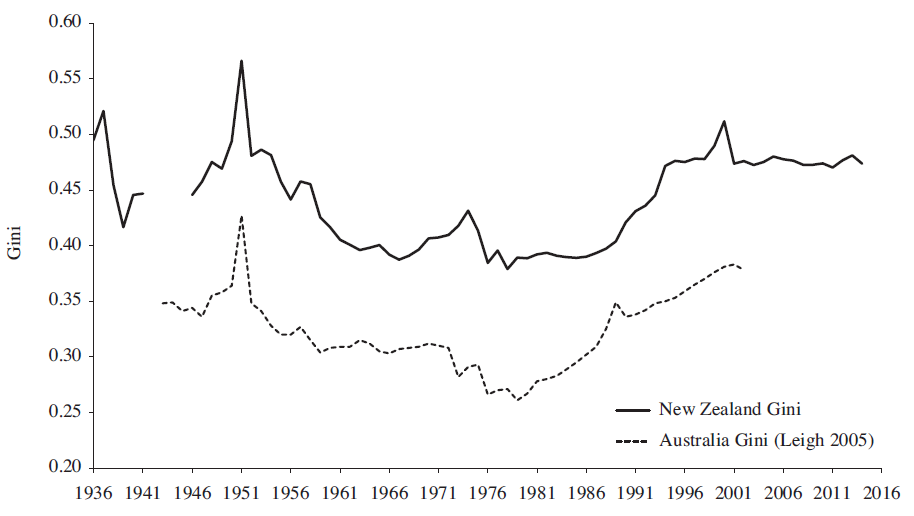
A number of short-term movements in the Gini are also common to both countries, such as the sharp spike in 1950-1951 associated with the wool price increase mentioned earlier. The greater volatility of the Gini estimates at the time of the global oil shocks in the early-to-middle 1970s is also reflected in the data for both countries. However, unlike New Zealand, Australian data do not reveal an obvious spike in 2000 when, as argued above, New Zealand incomes were probably subject to substantial responses to the 2000-2001 tax reforms. Unfortunately, the end of the Australian series in 2001 means that it is not possible to confirm whether the rise in Australian inequality was largely halted by 2000, as in New Zealand.
Gender analysis
Inland Revenue income data available from 1981 allow decompositions of taxpayers’ incomes by gender. Figure 3 compares the before-tax Gini coefficients for males and females with the equivalent for all individuals. The increase in inequality observed for all individuals in the 1990s was much more prevalent for males than for females. For example, the male before-tax Gini rises persistently from 0.34 in 1985 to 0.48 by 1995, but the female index rises only from 0.39 to 0.43 over the same period. Female inequality, having been higher than for males before the mid-1980s, became lower than for males from around 1991.
Figure 3. Gini before tax: Total income, 1981–2014
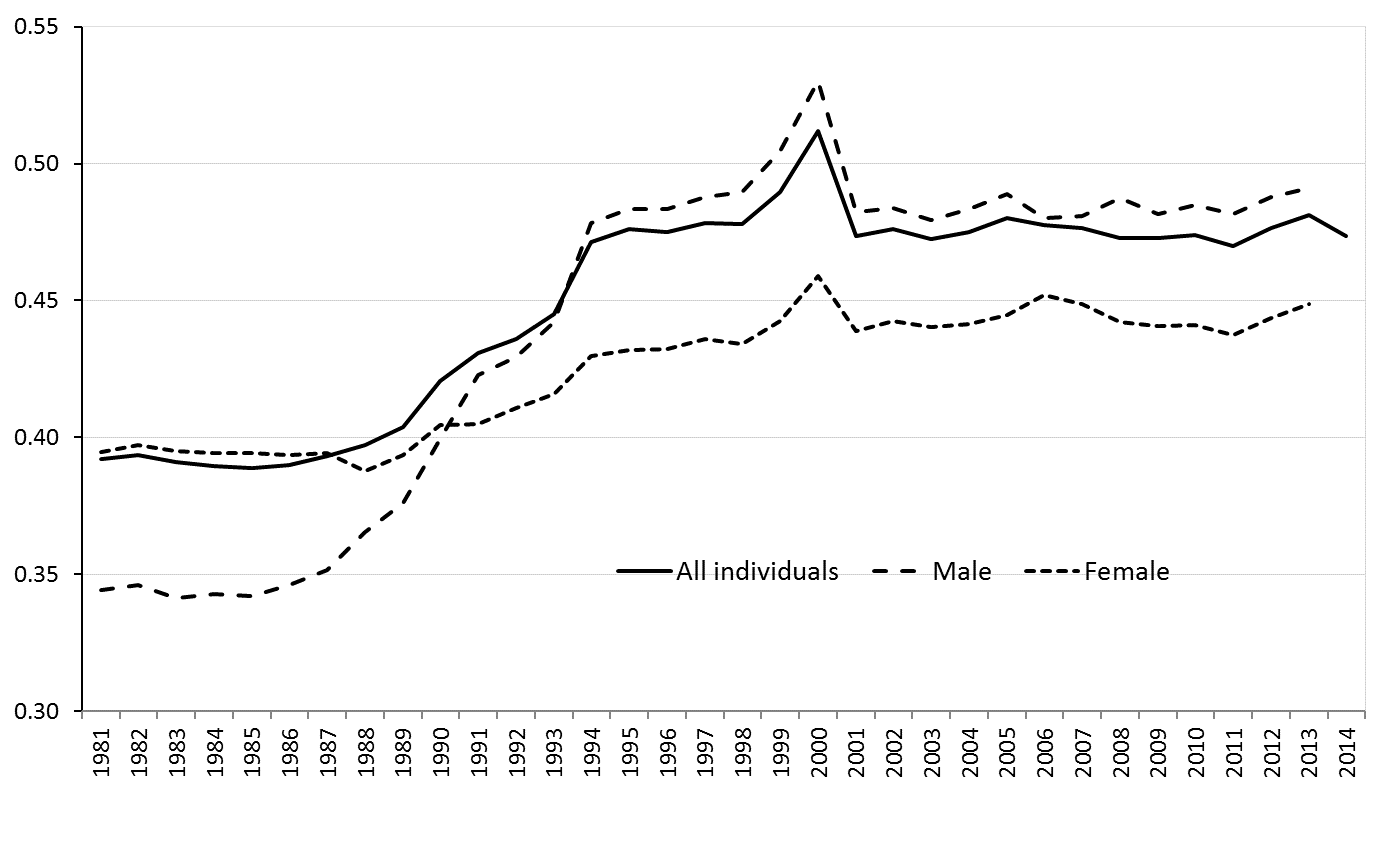
However, much caution needs to be exercised in interpreting both the level of, and trends in, male and female Gini indices. In particular, the data cover a period of increasing female participation in formal income-earning employment, and participation also involved greater use of part-time work by females, but less so over time. These are likely to have affected changes in measured income inequality, to an unknown extent.
Conclusion
Any empirical study of income inequality is severely constrained by available data, which are usually collected for tax administration purposes. In the present case the analysis is necessarily restricted to individuals and annual incomes. Furthermore, as in the case of the introduction of Pay-as-You-Earn in New Zealand, variations in the nature of the measured population group mean that published distributions cannot necessarily be taken at face value.
Care is required when, as here, the definition of what is included in ‘taxable income’ varies over time, involving, for example, variations in the administration of welfare benefits and whether they are included in taxable income. In New Zealand, the introduction of fringe benefits taxation in the mid-1980s is likely to have increased measured annual income inequality, without necessarily affecting the more fundamental dimensions of inequality.
One particular component of taxable income is also worth bearing in mind – the relatively generous taxable and ‘universal’ New Zealand Superannuation (NZS) introduced in 1977. This gives rise to a large mode in the total annual income distribution corresponding to those in receipt of NZS. An increase in the extent of superannuation payments (also partly associated with an ageing population) may increase measured annual taxable income inequality, but lifetime inequality may move quite differently.
With these caveats in mind, there is nevertheless some consistency in the evidence across Australia and New Zealand of declines in taxable income inequality in the decades following World War II, followed by an increase from the 1980s to the mid-1990s or early 2000s. Thereafter, at least in New Zealand, inequality appears relatively flat.
On gender aspects, the rise in inequality from the middle 1980s observed overall is especially prominent for females. This likely reflects, at least in part, the increasing participation of females in the labour force, likely to be characterised by lower hours levels and/or lower wage rates than male equivalents.
Finally, when examining long-period movements in inequality, there is always a danger of attributing causality to changes purely because they precede the change. This article has offered only an empirical description of income inequality changes over a long period, derived from available data and with some important caveats. However, hopefully this study can contribute to future analysis, and more informed public discussions of policy preferences and prescriptions on this important topic.


Recent Comments