
In 2014, Berkeley voted to pass “Measure D,” also known as a Sugar-Sweetened Beverage (SSB) tax (or more commonly as a soda tax), becoming the first city in the United States to institute such a policy and the first to do so through a local election. Measure D imposes a penny-per-fluid-ounce tax to be paid by distributors of SSBs, with the goal of reducing consumption of such beverages, or if demand is deemed unresponsive, raise tax revenues to fund nutritional programs and education.
SSB taxes have gained momentum in recent years because of rising awareness of potential negative health externalities resulting from excessive sugar consumption. While evidence is mixed that there are “market failures” in the context of food, or more specifically, sugar consumption (i.e. over-consumption that places an economic burden on society), many believe that these taxes can be used to correct food-related market failures should they exist.
Studies have found that there is a strong correlation between sugar consumption and chronic diseases like diabetes, heart disease, and obesity. Treatment of these diseases places a substantial economic burden on the healthcare system, the costs of which are not completely internalized by those being treated. For example, an obese individual may require more expensive healthcare than an average-weight individual, the costs of which are not completely borne by the obese individual because of the way insurance programs are typically structured. The Affordable Care Act, also known as “Obamacare,” shares costs among taxpayers, and employer-provided insurance policies similarly pool risk across workers, and so unhealthy people in both of these insurance systems drive up average costs for everybody. Sugar taxes have the potential to correct these externalities by making sugar consumers pay for the impacts of their consumption on the healthcare system as a whole.
There have been several studies attempting to estimate the impact of the Berkeley SSB tax on consumption of these beverages. Those using purchase data from retailers find reductions of approximately 10% in consumption of SSBs, while survey-based work finds much larger effects, reaching reductions as high as 50%. Additionally, there is some evidence that consumers may be “border shopping” and purchasing their SSB products just outside city limits. Given that the tax imposes a penny-per-fluid-ounce price increase, which will change relative prices depending on the size of beverages, the upper end of this range suggests that consumers of SSBs are highly responsive to price changes. The more responsive consumers are to price changes, the more “effective” taxes are in changing behavior. On the other hand, if consumers are relatively unresponsive to price changes, taxes will lead to significant revenue generation that can be used to influence consumption in other ways (e.g., educational programs).
Information and Social Norms vs. Prices
All of the work discussed above compares consumption of SSB products post-tax implementation vs. pre-election. However, in our recently published paper in Economic Inquiry, we go a step further and estimate changes in sales during the campaign and election periods, before the tax was actually implemented in the market. We find strong effects of the “Yes” election outcome on consumption before any beverages were taxed, suggesting that there is an important, non-price mechanism affecting individual behavior in this particular context.
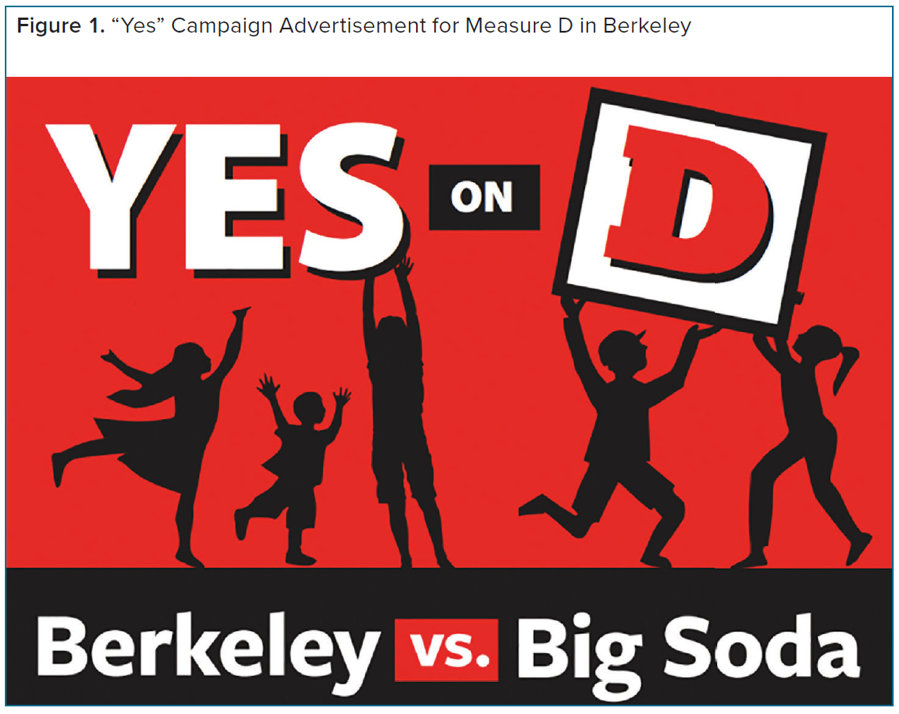
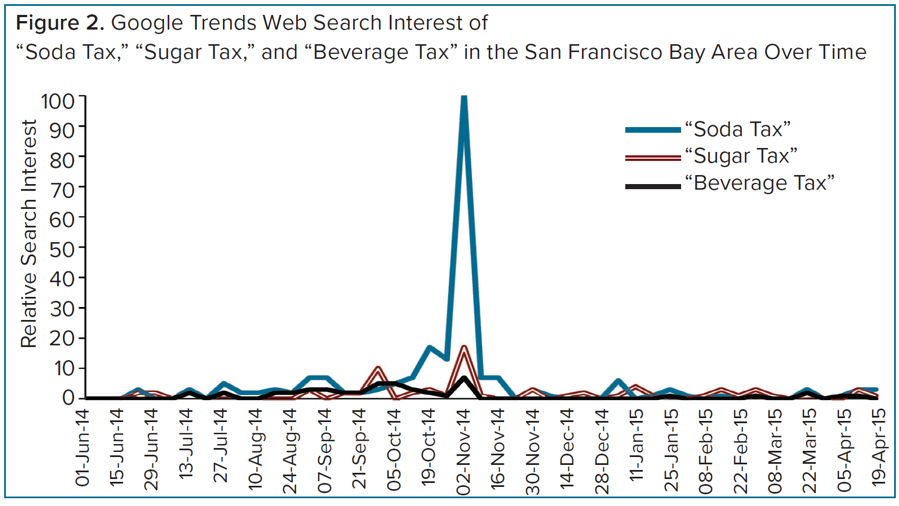
In fact, we estimate that this non-price effect is even larger than the actual price effect associated with the tax implementation. We look primarily at regular soda compared to other less-advertised SSBs (e.g., sports and energy drinks) and non-SSBs (e.g., milk and diet drinks), since the campaign and election focused on “Berkeley vs. Big Soda” (see Figure 1). There was also heightened attention and awareness about Measure D at the time of the election, as evidenced by “Google Trends” data shown in Figure 2. One can see that search interest in “Soda Tax” in the San Francisco Bay Area reached peak popularity right before the November 4, 2014 election, also indicating that people viewed Measure D primarily as a tax on regular soda products.
While it may be the case that storefronts in Berkeley changed prices after the election outcome and before the tax went into place, we have concretely identified a non-price mechanism because we have access to beverage sales on the University of California Berkeley campus, which did not adjust prices of SSB products until August 2016 (confirmed by the UC Berkeley food & dining administration). We also confirm no change in the availability of beverage products in these stores. These data include total ounces purchased by product-month, where products are identified by a specific “universal product code” (UPC).
In order to estimate reduction in sales of regular soda, we first identified the different impactful periods associated with Measure D in Berkeley. There are five important periods: the “pre-campaign,” “campaign,” “post-election/pre-city implementation,” “post-city/pre-campus implementation,” and “post-campus implementation.” We compare sales changes of regular soda in each of these periods to a set of reasonable control products (mentioned previously), after adjusting for time trends and overall level differences in product sales. Figure 3 below depicts our primary findings from analyses of the on-campus retail data.
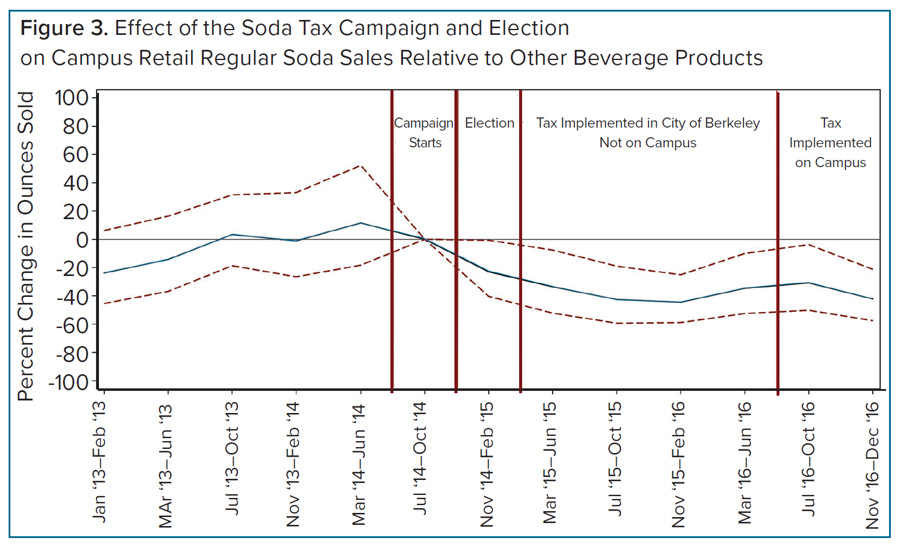
The vertical axis depicts the percentage change in ounces sold of regular soda versus the set of control beverages in each time-period (denoted on the x-axis) relative to the “campaign” period (July ’14 – October ’14). The solid black line represents these estimates, while the dotted lines represent the confidence intervals of these estimates. One can see that there is very little change in the relative ounces sold of each of these groups until Measure D passed on November 4, 2014 (as indicated by the upper bound of the confidence interval falling below 0%).
Our findings suggest regular soda sales fell on the Berkeley campus by 10-20% compared to the control category beverages in the “post-election/pre-city implementation” period (November ’14-February ’15). We find additional drops in the “post-city/pre-campus implementation” period (March ’15-July ’16), but by lesser magnitudes than 10-20%. Note that there was still no price change on the Berkeley Campus during this time, so additional reductions were not a result of increased prices of SSBs on campus. Overall, we find reductions of 18-36% in regular soda sales across these two periods compared to the “campaign” period. Furthermore, we find no additional declines in regular soda sales in the “post-campus implementation” period (August ’16-December ’16) when prices of all diet and regular SSB products increased by $0.25.
Another important policy question is whether or not these non-price effects are persistent long after the election. Our study examines sales effects two years after the election outcome (through December ’16), finding that there are indeed lasting declines in sales. All of our on-campus findings are backed up by A.C. Nielsen retail scanner data from storefronts in the City of Berkeley, albeit with slightly lower magnitudes.
Conclusions
Highlighted news coverage and local elections play an important role in disseminating information to the public, and this information can change behavior. Investigating whether campaigns and elections also lead to behavioral changes, whether through information or social norms channels, has important policy implications about how and where SSB policies may be effective in altering SSB consumption. For example, if the social norm revealed by the election was the driving mechanism behind the consumption change, and not information revealed by the media campaign, we might expect larger effects when consumers identify more closely with other voters.
While policies adjusting prices are important levers to change habits and boost economic welfare, the effectiveness of certain policies may depend on non-price mechanisms. Local elections may be a powerful tool to change decision-making processes of consumers, especially to the extent that they highlight information awareness campaigns and election outcomes to their populace. When thinking about SSB taxes (or other types of policies affecting consumers) in other cities, the most important takeaway is that consumer responses may depend on the presence of an information campaign or public vote leading up to policy action.
An interesting line of further research may be to identify the extent to which campaigns and elections lead to behavioral changes in situations when elections did not lead to actual policy changes. For instance, in 2014 San Francisco did not elect to pass a soda tax, but still had a campaign preceding the election. In addition, there are other products that have been subject to campaigns without election implications, for example the Food and Drug Administration’s anti-vaping campaign “The Real Cost.” There may be ways to identify these information effects more distinctly by examining different types of campaign and election processes in other products.
Note: Researchers’ own analyses calculated based in part on data from The Nielsen Company (US), LLC and marketing databases provided through the Nielsen Datasets at the Kilts Center for Marketing Data Center at The University of Chicago Booth School of Business. The conclusions drawn from the Nielsen data are those of the researchers and do not reflect the views of Nielsen. Nielsen is not responsible for, had no role in, and was not involved in analyzing and preparing the results reported herein.
The article first appeared on ARE Update, a bimonthly magazine published by the University of California Giannini Foundation of Agricultural Economics.


Recent Comments