

Propping up compliance is the constant worry of tax authorities around the world. This concern is more pronounced for developing countries, such as India, that seek to achieve numerous economic objectives through tax incentives. The policymakers’ concern of low tax-to-GDP ratios can be remedied by broadening the taxpayers base while eliminating underreporting. As will be shown, the latter remains an important means to achieve better compliance in India.
Increasing tax compliance
Historically, India has had a schedule-based personal income tax rate. In the early 1970s, there were eleven slabs with a peak rate at 85 per cent applicable to incomes over 0.2 million rupee. Successive government committees were of the view that a tax system, though progressive, should not induce the generation of unaccounted income and wealth. Bearing in mind the adverse impact of high tax rates, the rate structure has been rationalised over time. As of today, there are three slabs and the peak rate is 30 per cent on incomes above 1 million rupee. Concomitantly, reforms such as the change in rule for selection of cases for scrutiny assessment, offer of amnesty and third party information collection were implemented to create a less intrusive tax department, geared towards encouraging voluntary compliance. Nonetheless, the limits imposed by tax exemptions resulted in a narrow taxpayer base. Until 2014-15, less than 2 per cent of the population were taxpayers. Given the fiscal tight rope, the only leverage available is tax compliance.
But what is it that induces better compliance behaviour among individuals? Up until our lab-based experiment, there was no empirical evidence to answer the question for India. Compliance is paying tax due by registering as a taxpayer and declaring all income in filed tax returns. This experiment focuses on the behavioural response to policy instruments that aim to improve compliance with regards to tax declarations.
The merit of a lab-based experiment to study tax compliance is twofold. Firstly, evasion rates among filers is not observed in actual tax data. This experiment with its diverse set of participants allows us to observe the compliance rate. Secondly, instruments that are used to influence compliance behaviour have revenue implications. Thus, a judicious choice must be made between alternative instruments. Through the introduction of a series of changes, this experiment allows us to evaluate different instruments. The question we seek to answer is: Which policy instruments (of those that are often deployed) can influence reporting behaviour among individuals?
The experiment
The intent of the experiment was to elicit knee-jerk responses under conditions perceived by taxpayers as normal. In addition to conventional instruments, such as the tax rate, penalties and the chance of audit – which may affect compliance rates (defined as declared income as a fraction of total income) –, the recent literature has emphasised the role of social norms and public goods. For example, among recent work Blaufus et al.(2016) explore the impact of shaming on taxpayers’ compliance. Publicising the names of tax evaders is one often-used social norm strategy, and it has been employed by the Indian Tax Department.
To mimic the actual policy environment, the tax rate was cut, the penalty rate was increased, declared audit probability was reduced, names of tax evaders caught were publicised and the exemption threshold (income below which no tax is paid) was raised, in that order.
Theoretical foundations to tax compliance trace back to the Allingham-Sandmo model (1972). Over time, the predictive power of such models has been called into question because of subtle differences in risk preferences that could alter predicted behaviour. Nevertheless, there is an expected direction of impact for each of these policy measures. For example, a reduction in tax rates, an increase in exemption threshold, a higher rate of penalty and shaming of tax evaders are expected to raise compliance rates, either as an act of reciprocity for lower tax liabilities or as a response to deterrents. On the other hand, lower audit probability can reduce compliance rates.
In this experiment, conducted in 2015, there were 111 participants from diverse age groups, income category and occupations. In the experimental literature, a common criticism about the general applicability of results is the use of student population. In our sample, there were equal numbers of student and non-student participants, and no statistical difference was observed between the reporting behaviour of the two groups.
Do individuals respond as expected?
It is often assumed that there are unidirectional responses to policy changes. However, the results of this analysis contradict such a notion. As one may expect, a reduction in tax rates should result in higher compliance rates. However, our experiment shows that there are participants who in fact reduce reported incomes. One way to rationalise such a response is that a lower tax rate reduces the tax liability, which in the instance of being caught can also have the impact of lowering the penalty.
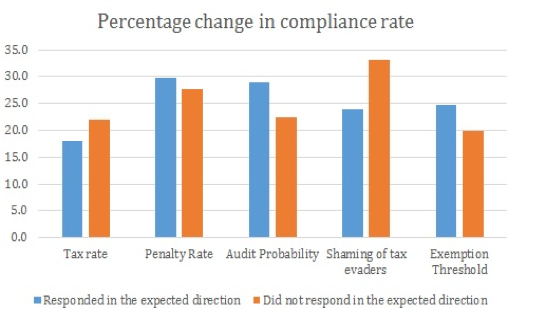
Similarly, for all other instruments, the results show that there are individuals who will respond in a counterintuitive manner (Figure 1). The blue bars in Figure 1 represent those who responded as expected and, as is seen, this is more likely in regards to changes in the audit probability. As for the mean (percentage) change in compliance rates (Figure 2), the ‘unexpected’ response outweighs the expected response in case of tax rates and shaming of tax evaders. In fact, the tax rate among all the variables has the most ambiguous impact on compliance.
Figure 1. Direction of change in compliance rates
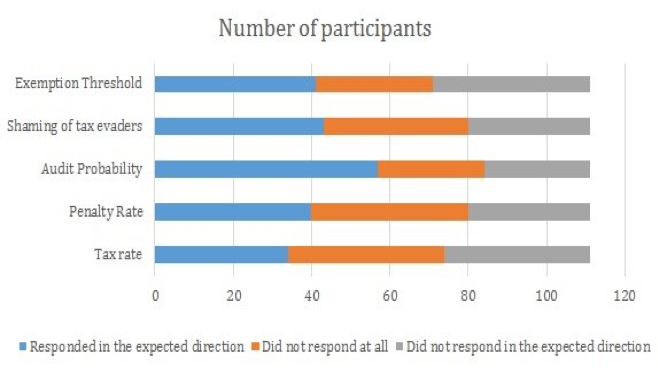
Figure 2. Amount of change in compliance rates
What are the preferable policy instruments in the light of these findings? Two important considerations must be factored in while making such a choice.
Firstly, even though it seems that the audit probability has a strong effect on the reporting behaviour, the unexpected response of some may require to pursue a mix of policies simultaneously. For this purpose, it is important to identify the instruments that may serve as substitutes or complements.
Secondly, each of the policy changes and the consequent compliance responses have ramifications on revenue collections. Since the purpose of tinkering with the instrument is to increase revenue collections, it may be of use to evaluate each instrument.
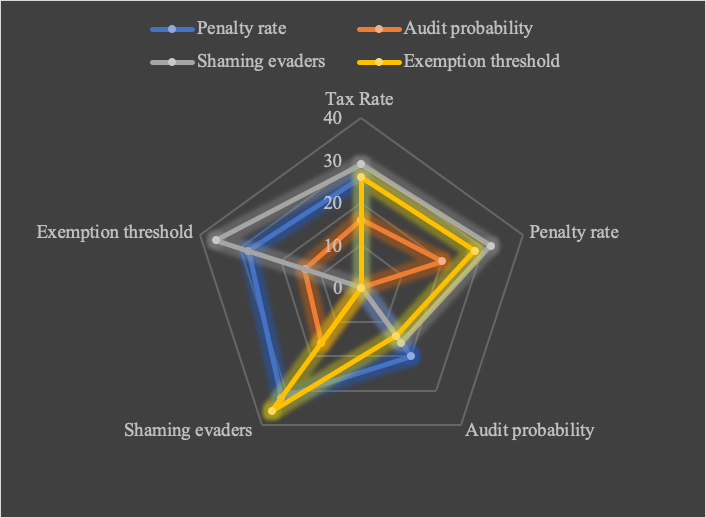
To avoid using multiple instruments that generate similar results, we identify the extent of overlap for each pair of policy instruments, in terms of the number of participants who respond in the expected direction. Overlap is observed for the pair of penalty rate and shaming of evaders as well as for the exemption threshold and shaming of evaders. On the other hand, very little overlap is observed for changes in the audit probability (Figure 3). In fact, adding up the number of instruments that affect individual behaviour, we find that of those who respond to the audit, a large fraction do not respond to any other instrument in the expected way.
Figure 3. Number of individuals responding to a pair of policy changes
A tax department that cannot observe individual characteristics and that seeks to target compliance of such a population—assuming symmetry in the direction of response—can choose to raise the audit probability declared to taxpayers and, in addition, choose from penalties, shaming of evaders or exemption thresholds. The choice among these can be made on the basis of the impact of revenues.
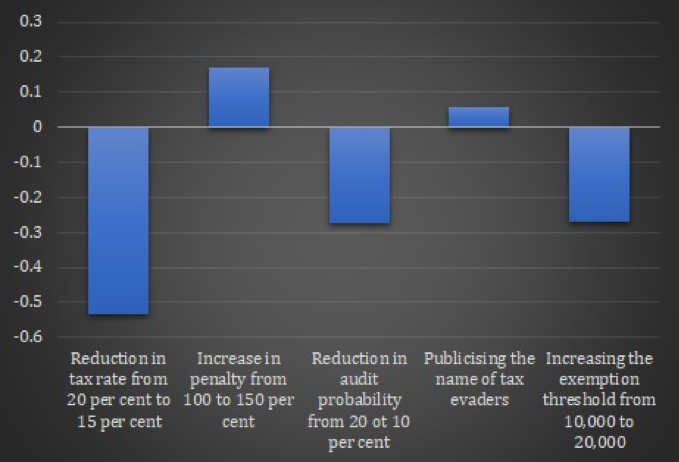
In our sample, revenues (consisting of tax collections plus penalties) are estimated. Figure 4 allows us to conclude that, even with all other factors remaining the same, if the tax rates or exemption thresholds were to be reduced such that individuals’ tax liability is reduced, these measures will certainly result in lower revenue collection. Thus, these two instruments may not be preferable due to their impact on revenue collection. Having eliminated exemption threshold on this basis, it may be a better option to raise that rate of penalty or to publicise the name of evaders.
Figure 4. Change in revenue collected in comparison with baseline scenario (in millions)
Adding to the declared probability of audit is the experience of being audited. In the experiment, participants were selected at random in each round for an audit. However, the compliance behaviour was not statistically different between those who were audited and those who were not. This held true whether we assessed the impact immediately after an audit in a previous round or repeated audits across the experiment.
It may seem paradoxical at first that while the chance of audit can impact compliance rates, the audit itself is not corrective. A theoretical explanation is possible for the observed behaviour. Since individuals factor in their chance of being audited at the start, they decide to declare income based on the knowledge of expected payoffs, given the two states of the world—getting caught and not getting caught. Therefore, the actual audit is only a credible threat but it does not alter individual behaviour post facto.
Conclusion
The key takeaway from this experiment is that individuals can respond in many ways to various policy changes. To expect people to respond as expected, or not at all, will not be entirely accurate, and the possibility of counterintuitive responses must be borne in mind while designing policy.
Yet, given the diverse responses, a set of policy changes can be undertaken simultaneously or sequentially. The threat of an audit, which showed the most pronounced effect, can be complemented by shaming of tax evaders or by the imposition of penalties. The results from the experiment make a compelling case for policymakers to desist from reducing tax rates, which has ambiguous effects on compliance and adverse effects on revenue.
This article is based on a revised version of the paper: Tandon, S & Rao, RK 2017, ‘Tax Compliance in India: An Experimental Approach’, NIPFP Working Papers 17/207, National Institute of Public Finance and Policy. The author also presented this work at the 2018 TTPI Behavioural Economics and Public Policy Conference. Audio recording and slides are available on the TTPI website.


Recent Comments