

This post is the third of a four-part series on the topic.
The existence and the extent of “zero net taxpayers” is a reflection of the interaction between the level of cash benefits; how we distribute them; and the level and structure of taxation and how progressively it is collected. As discussed in previous posts, discussion of “zero net taxpayers” has also arisen in the US, UK and NZ. So how does Australia compare?
Compared to other rich countries, Australia is relatively low in terms of government spending and taxation, having the third lowest level of government spending in the OECD and the fourth lowest level of overall government revenue. One of the major explanations for our overall low level of spending is that we have one of the lowest levels of spending on social security in the OECD. Total government spending in Australia is about 80% of the OECD average, spending on areas other than social protection is about 90 % of the OECD average, but spending on social protection is only about 60% of the OECD average. Given that spending on social protection in most rich countries is the largest single component of overall government spending, our low level of social spending is one of the most important factors explaining our relatively low level of taxation.
This is primarily due to our low level of spending on cash benefits – as shown in Figure 1 spending on cash benefits in 2014 was 8.6% of GDP, the sixth lowest level of 34 OECD countries.
The reason why Australia has a low level of spending on social security is that our system differs markedly from those in most other countries. In Europe, the United States and Japan, social security is financed by contributions from employers and employees, with benefits related to past earnings; this means that higher-income workers receive more generous benefits if they become unemployed or disabled or when they retire. By contrast, Australia’s flat-rate payments are financed from general taxation revenue, and there are no separate social security contributions; benefits are also income-tested or asset-tested, so payments reduce as other resources increase. The rationale for this approach is that it reduces poverty more efficiently by concentrating the available resources on the poor (“helping those most in need”) and minimises adverse incentives by limiting the overall level of spending and taxes.
The Australian system relies more heavily on income-testing than any other country in the OECD. The 2014 Social Expenditure Update from the OECD shows that nearly 80% of Australian cash benefit spending is income-tested[1] compared to just over half in Canada, 37 % in New Zealand, around 26% in the United Kingdom and the United States, and less than 10% in most European countries.
As a result, our system directs a higher share of benefits to lower-income groups than any other country in the OECD. The poorest 20% of the Australian population receives nearly 42% of all social security spending; the richest 20% receives around 3%. As a result, the poorest fifth of Australians receives twelve times as much in social benefits as the richest fifth. In the United States the poorest get about one and a half times as much as the richest. At the furthest extreme are countries like Greece, where the rich are paid twice as much in benefits as the poorest 20%, and Mexico and Turkey, where the rich receive five to ten times as much as the poor.[2]
In addition to social insurance programmes most other OECD countries do have a range of income-tested social assistance programmes which provide a safety net for those who have not been able to participate in contributory social insurance systems (because they have had interrupted work histories due to caring responsibilities, or because they are migrants, or because they have a disability before reaching working age, or because their low wages when in work mean that their social insurance does not provide a minimally adequate standard of living when they need it).
Figure 1: Spending on cash benefits, OECD, 2014 or nearest year (% of GDP)
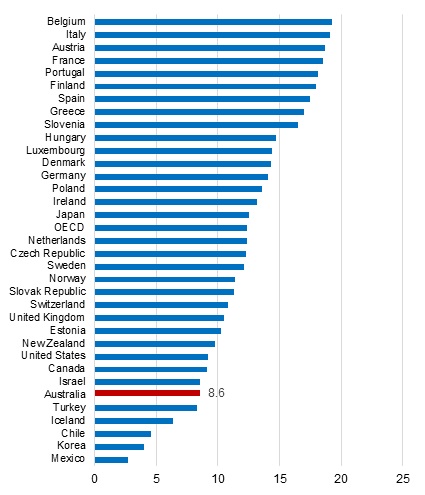
Source: OECD Social Expenditure database,
Usually these social assistance programmes are even more targeted to the poor than the Australian system – with much tighter tests on assets, higher withdrawal rates on benefits and more restrictive eligibility conditions – but given their lower profile in the social security system as discussed above, these systems cover a much smaller proportion of their populations. These programmes are intended to complement more encompassing insurance arrangements, so that even while Australia has less restrictive means-testing the system as a whole is much more targeted to the poor. What this means is that when we compare the Australian system with those in other countries, we need to look at not only the structure and progressivity of taxation but also the mix of different types of cash transfers and how they are structured.
Income testing or taxing – different approaches to targeting welfare
A corollary of the fact that our benefit system targets the poor more than any other country is that we also have a tax system that claws-back less of our spending. Recent OECD studies have pointed to the extent to which taxation interacts with the design of social security (Adema et al., 1996; Adema, 2001; Adema and Ladaique, 2005; OECD, 2014).
Figure 2 shows OECD estimates of the level of direct taxes (income taxes and employee social security contributions) that are paid out of cash transfers. In Australia direct tax payments made from social security benefits amount to only 0.2% of GDP, with the only countries with lower levels of direct tax paid out of benefits being lower income countries. At the other extreme, high spending Nordic welfare states collect direct taxes on benefits of close to 3% of GDP, or in the case of Denmark around 4% of GDP.
Figure 2: Clawback of cash transfers through direct taxation, % of GDP, OECD countries, 2011
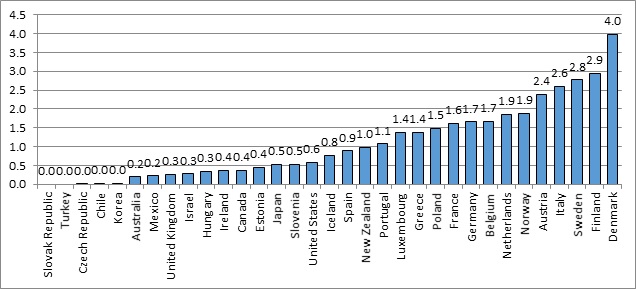
Source: OECD Net Social Expenditure indicators
Figure 3 shows estimates of clawbacks through indirect taxes, including the GST in Australia and value added taxes in Europe. Again, Australia has one of the lowest levels of clawback through indirect taxation in the OECD, at around 0.7 % of GDP with levels of indirect taxes paid on benefits exceeding 2.5% of GDP in a range of Nordic and other European welfare states.
Figure 4 shows the combined effects of direct and indirect taxation on the level of social spending, but expressed as a percentage of gross social spending. Australia has the equal third lowest level of tax clawback in the OECD in 2011, at 4.9% of social spending. At the other extreme in Luxembourg, Finland and Denmark 20% of their much higher level of spending is clawed-back.
Figure 3: Clawback of net cash transfers through indirect taxation,% of GDP, OECD countries, 2011
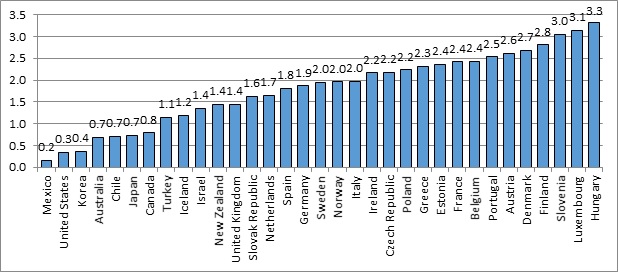
Source: OECD Net Social Expenditure indicators
Figure 4: Total clawback of cash transfers through direct and indirect taxation, % of gross social spending, OECD countries, 2011
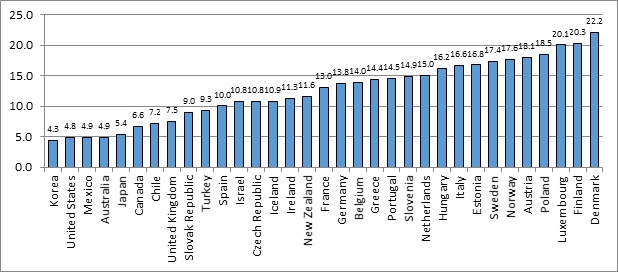
Source: Calculated from OECD Net Social Expenditure indicators
The fact that Australia overall has the most income-tested social security system of all OECD countries is linked to the fact that we tax cash benefits less than most countries. Income-testing is a way of “taxing in advance” rather than clawing back spending through the tax system after payments have been made. Each can be regarded as differing ways of seeking to achieve broadly similar goals.
The decision to have low levels of tax payable on benefits follows from the logic of targeting payments to the poor. If in the benefit system we want to make sure that we direct assistance to those most in need, it would not make sense to tax benefits heavily – it would imply that we are paying basic benefits that are “over-generous”. In contrast, in Nordic countries spending on cash payments is more universal in its distribution, so clawing back through the tax system is a logical approach. In European countries with high replacement rates for payments, it is logical to tax benefits like other sources of income.
How progressive are taxes in OECD countries?
The degree of progressivity of the tax system is conventionally measured by the rate of increase in taxes as income increases (OECD, 2008), that is the difference between the tax rates paid by high income and low-income groups. A low level of taxation on low-income households therefore contributes to the progressivity of the direct tax system, other things being equal.
Analysis by the OECD in Growing Unequal (2008) found that direct taxes are most progressively distributed in the United States, reflecting the greater role played there by refundable tax credits, such as the Earned Income Tax Credit and the Child Tax Credit. Low-income groups in the United States pay very low taxes because these credits can mean that the Internal Revenue Service actually pays money to them (i.e. negative taxes because these tax credits are “refundable”).
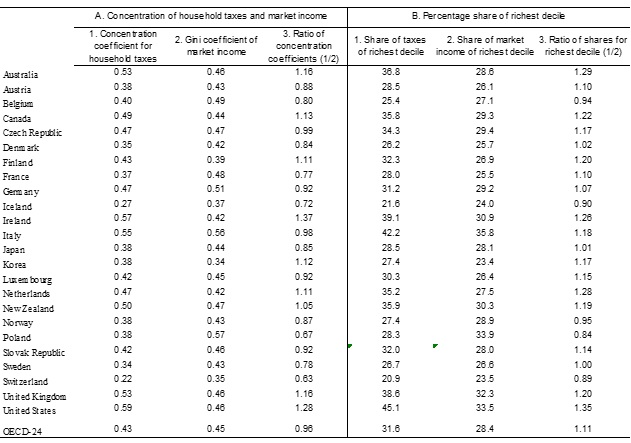
Table 5 compares the progressivity of direct taxes (income tax and employee social security contributions) in OECD countries around 2005, showing the concentration coefficient for taxes and the share of taxes paid by the richest 10% of households.
After the United States, the distribution of taxation tends to be most progressive in the other English-speaking countries – Ireland, Australia, the United Kingdom, New Zealand and Canada– together with Italy, followed by the Netherlands, the Czech Republic and Germany. Taxes tend to be least progressive in the Nordic countries, France and Switzerland.
In most but not all countries taxes are more progressive for the retirement-age population than for the working-age population, reflecting the existence of various tax concessions for low-income retired people. Australia has the most progressive distribution of taxes for people in retirement age households – put another way, most households of retirement age in Australia pay little or no direct taxes.
However, the progressivity of the tax system also depends on the level of inequality of taxable income, and the effective progressivity of a given tax schedule will be greater in a country with a more unequal distribution of taxable income. To come back to the argument put by the former Treasurer, Joe Hockey, that high-income groups pay a very high share of taxes, the main reason for this that they have a much higher share of income than their share in the population.
For example, the World Wealth and Income Database shows that the richest 10% of Americans have about 48% of total income compared to shares of around 28% for the richest 10% of the Swedish or the Norwegian population. The richest 10% of Australians in 2012 were closer to the Swedish than the American end of this spectrum, holding about 30% of total income. But this implies that even if the tax system was proportional in its incidence, we would expect the richest 10% of Australians to pay 30% of direct taxes, and depending on the progressivity of the tax scale their share of taxes would be even higher.
Table 5 (derived from OECD, 2008) also adjusts for this effect by showing the concentration coefficient[3] of household taxes divided by the Gini coefficient for market income (in the third column), as well as the share of taxes paid by the richest 10% of the population compared to the share of market income they receive (sixth column).
Table 5: Alternative measures of progressivity of taxes in OECD countries, 2005
Source: Computations based on OECD income distribution questionnaire.
Based on the concentration coefficient of household taxes, the United States has the most progressive direct tax system in the OECD and collects the largest share of taxes from the richest 10% of the population. However, the richest decile in the United States has one of the highest shares of market income of any OECD country. Standardising for this underlying inequality, has some effect but not a major one – Ireland has the most progressive direct tax system as measured by the ratio of the concentration coefficients of household taxes and market income, with the United States and Australia still coming in at second and third positions respectively, while Australia and the United States collect the most tax from people in the top decile relative to the share of market income that they earn.
Net tax thresholds in OECD countries
The discussion above has highlighted that Australia has both relatively low levels of total tax revenue and of spending on cash transfers, but has the most progressive distribution of benefits in the OECD and one of the most progressive systems of direct taxation. Does this mean that we have either more or fewer net taxpayers than other OECD countries?
By definition, all tax-transfer systems will produce net tax thresholds where taxes payable start to exceed benefits received. If tax rates rise as market income rises and if benefits shares tend to fall as income rises, then again by definition there must be an income level where the distributions cross. But given the differences in tax and benefit structures in OECD countries discussed above, how different are net thresholds likely to be?
We can address this question through the OECD database on Benefits and Wages. The OECD notes:
“The OECD Tax-Benefit models show how complicated tax and benefit rules can affect the net income of families when they are in and out of work. The models are part of the OECD’s database on tax-benefit policies, which monitors redistribution policies, income adequacy and benefit generosity for working-age people and their families over time and across countries. They also show how much families gain from employment, accounting for benefits, taxes and other work-related costs, such as for childcare. The latest update of the indicators covers the period from 2001 to 2014”
The Benefits and Wages database includes a series of excel spreadsheets setting out the components of disposable income for a wide range of cameo households (singles, lone parents, one and two earner couples with and without children) of working age. The spreadsheets separately identify the income components for people entitled to contributory benefits and income-tested benefits, including income support payments, rent assistance and family benefits received, minus income tax and employee social security contributions payable for levels of earnings, broken down by 1 % of the average wage from no earnings (i.e. completely reliant on social security benefits) up to 220 % of the average wage[4] in each country. They also show the effective marginal tax rates produced by the interaction between all these elements at each percentile of earnings, as well as gross income (the sum of earnings and benefits) and disposable income (gross income minus taxes and employee social security contributions). From these figures it is possible to identify the earnings level at which taxes paid exceed benefits, and the individual stops being a “zero net taxpayer”.
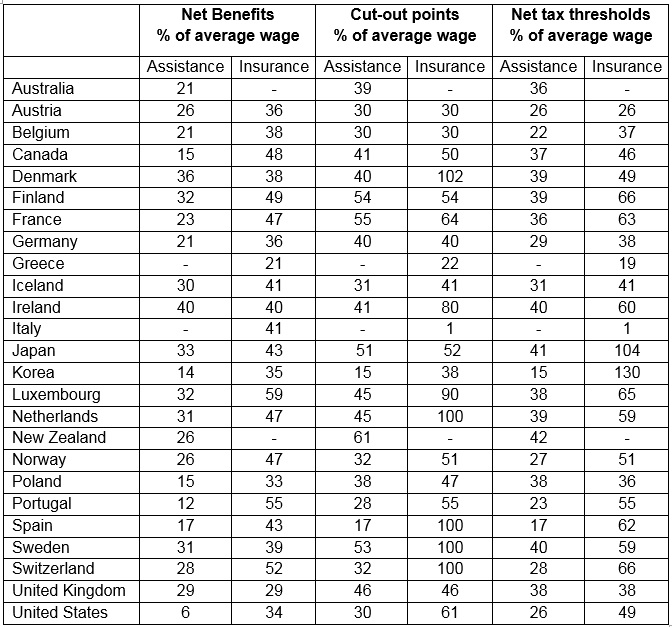
Table 6 shows calculations of net tax thresholds for the simplest case of a single person of working age for selected OECD countries in 2014, separating out the case of an individual entitled to unemployment insurance (not relevant in Australia and New Zealand) or income-tested unemployment assistance (not relevant in Greece and Italy).
Table 6: Net tax thresholds and related parameters, OECD countries, 2014
Source: Calculated from OECD Benefits and Wages database.
To facilitate cross-country comparisons the figures are expressed as a percentage of the average wage in each country.[5] In addition, to assist in understanding why net tax thresholds differ across countries, the table shows the basic level of net benefits also expressed as a percentage of the average gross wage and the cut-out points for insurance and assistance benefits as a percentage of the average wage, remembering that net tax thresholds must be below the benefit cut-out point. The calculations also include the level of assistance with rental costs.
Table 6 shows that the combined level of Newstart and Rent Assistance for a single person at 21% of the average wage is equal 15th out of 23 OECD countries when comparing assistance payments; compared to unemployment insurance payments (for the short-term unemployed) Australia is equal lowest. The cut-out point for payments in Australia ranks 13th compared to other income-tested payments and 19th compared to insurance payments.
In most cases, net tax thresholds are higher for people receiving insurance benefits than they are for people in the same country receiving assistance benefits, which is mainly a reflection of the higher level of insurance payments. The net tax threshold in Australia ranks equal 12th compared to other assistance payments and 19th compared to insurance payments. Overall, therefore we are in the middle or lower half of OECD countries in terms of the level of income at which single people effectively begin to pay tax. (We could also expect that receipt of social insurance benefits for other contingencies or life stages – sickness, disability, widowhood or retirement – will produce generally higher net tax thresholds than in Australia.)
The countries with the lowest net tax thresholds for single people are Italy and Greece. This is because these countries do not have national social assistance schemes and they start to pay social security contributions as soon as they have any earnings. In the case of Italy, they completely lose their insurance benefits as soon as they have any earnings at all, while in Greece the contributory benefit is actually reduced Euro for Euro as earnings increases, which combined with the social insurance contributions they still pay on these earnings produces an effective marginal tax rate of 115.5%.
Thus low net tax thresholds in these two countries mean that unemployed individuals have virtually no incentive to work – or if they are working no incentive to declare their income. While there are additional factors to be taken into account, estimates by Schneider (2015) are that the “shadow economy” (undeclared work and under-reported income) are in excess of 20 % of GDP in Greece and Italy compared to his estimate of around 10 % of GDP in Australia.
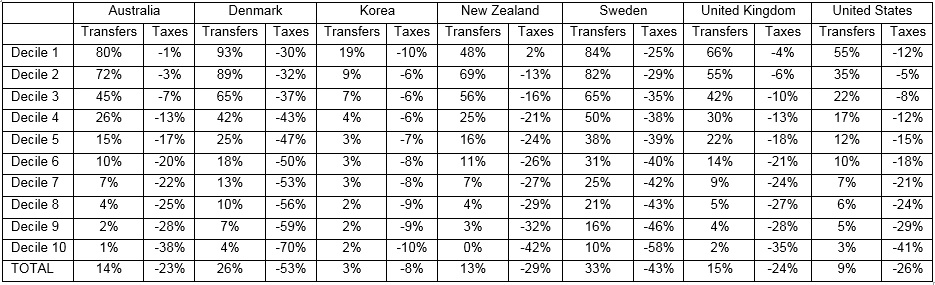
Other data from the OECD can be used to inform the question of whether these differing net tax thresholds produce varying shares of “zero net taxpayers” in different countries. Table 7 shows data from the OECD Income Distribution Study of the share of disposable income received in transfers or paid in direct taxes by income deciles for selected OECD countries.
Table 7: Share of transfers and taxes in disposable incomes by decile of equivalised disposable income
Selected OECD countries, around 2005, % of income of decile
Source: OECD Income Distribution data, mid-2000s.
In the case of Australia what these figures mean is that the lowest income group receive 80% of their disposable income from benefits and pay 1% of their disposable income in taxes, while the richest 10% receive 1% of their income from benefits and pay 38% of their income in taxes – and so on.
From figures of this sort it is therefore possible to identify the decile in which taxes on average exceed transfers. In the case of Australia this is decile five, where transfers account for 15 % of disposable income and taxes are a little higher at 17 % of disposable income. Since this is the 5th decile it means that somewhere between 40 and 50% of Australian households are “zero net taxpayers” – a figure consistent with the estimates discussed earlier. To take the case of the United States, the turnaround point is also in the fifth decile, where transfers at 12% of disposable income are less than taxes at 15% of disposable income.
It can also be seen that the turnaround point is also in the fifth decile in New Zealand, but also in Sweden, where transfers are more than twice as high as a share of overall household income than in Australia and taxes are nearly twice as high.
It is notable, however, that the turnaround point in Denmark is somewhat lower in the 4th decile where taxes at 43% of income are slightly higher than transfers at 42% of income. This implies that somewhere between 30 and 40% of Danish households are “zero net taxpayers”. Moreover, in the case of Korea it is also the 4th decile where taxes first exceed transfers (6% compared to 4%).
What this suggests is that the point at which households become zero net taxpayers is not determined simply by the level of taxes or transfers. Transfers as a share of total household income are eight times higher in Denmark (26%) than in Korea (3%) and taxes are nearly seven times as high in Denmark (53%) as in Korea (8%), but despite these vast differences the turnaround point is in the same income decile.
This is because there is an implicit trade-off between the level and progressivity of spending and the level and progressivity of taxes. High levels of spending are generally taken to require higher levels of taxation, and higher levels of taxation generally require less progressive tax structures (OECD, 2008).
An important point to note is that there is a difference between the share of taxes paid by high-income groups and the share of their income that they pay in taxes. Because Australia has a lower overall tax take than many countries, in our case the share of income paid by higher income groups is lower than in many other countries even though the share of taxes they pay is relatively high. For example, Table 5 showed that the richest decile in Australia paid just under 37% of direct taxes, compared to 26% in Denmark, just under 36% in New Zealand, and around 27% in Sweden.
Table 7, however, showed that the average direct taxes paid by the richest decile in Australia was 38 % of their disposable income compared to 70 % in Denmark, 42 % in New Zealand and 58 % in Sweden. The low tax rates paid by low-income groups in Australia flow through to higher income groups because the tax threshold is available to all taxpayers as is the relatively low first tax rate. So in the case of New Zealand, even though the highest marginal rate is lower in Australia’s the highest income decile pay higher taxes on the first tranches of their income, producing a higher average tax rate for this group.
Using the same data source, Table 8 shows the income deciles where households on average become “zero net taxpayers” for a wider range of OECD countries.[6]
The turning point for Australia is in the fifth decile. This means that between 40 and 50% of the total population receive more in benefits than they pay in taxes. This is also the turning point in Canada, the Netherlands, New Zealand, Norway, Sweden and the United States. Denmark, Finland and Korea have fewer “Zero net taxpayers” with the remaining countries having more.
For people of working age, the turning point is between the third decile and the fifth decile, with the largest number of countries including Australia being in the fourth decile. This is higher than the share shown in Table 4, reflecting the fact that these figures are calculated from grouped data rather than directly from micro-data, meaning that they are less precise.
Table 8: Zero net tax deciles, selected OECD countries, 2005
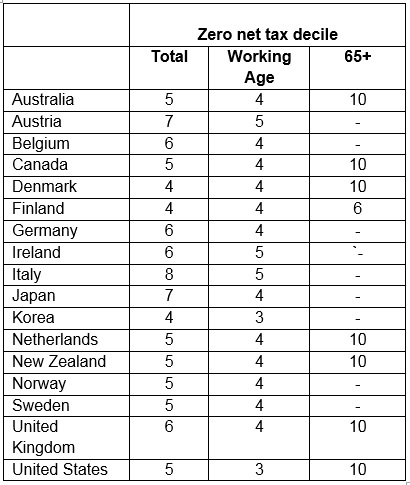
Source: Calculated from OECD income distribution data.
In general, people over 65 have much more favourable tax treatment and are much more likely to receive social security payments than other people. For households with a head over 65 years, many countries have a turning point in the top decile, meaning that more than 90% of these households receive more in pensions than they pay in taxes. Countries marked by a dash have no turning point – that is, on average no one over 65 pays more in taxes than they receive in payments (this is an aggregate figure; there may in fact be some people who pay more in taxes, but the number is likely to very small). Finland appears to be an anomaly with the turning point being in the sixth decile; this is because Finland has a very large occupational pension system which covers most people in this age group, but which is not classified as social security spending.
Part four of this series will discuss the dynamics of “zero net taxpayers” from a lifecourse and risk perspective.
The full article on which this post is based can be found at the TTPI website.
[1] The OECD figures include spending on State government workers compensation schemes and Commonwealth and State civil service pensions’ which are not income-tested.
[2] This is related to the fact that in low income countries, only people who are in the formal labour market have membership pf social security schemes, and these households have higher incomes than those in the informal labour market.
[3] The concentration coefficient is calculated in the same way as the Gini coefficient, but with households ranked by their income rather than the taxes they pay. The higher the concentration coefficient the greater is the share of taxes paid by high income groups i.e. the more progressive is the tax system.
[4] Earnings are expressed in national currencies. In the case of Australia the average wage figure in 2014 was $79,409, which means that 1 % of the average wage was $794 or roughly $15 per week.
[5] For a discussion of issues related to the use of replacement rates and comparisons of average wages across countries, see Whiteford (1995) http://onlinelibrary.wiley.com/doi/10.1111/j.1468-246X.1995.tb00427.x/abstract.
[6] In a number of countries (Greece, Mexico) it is not possible to identify the turning point, because the original data are collected net of income taxes paid, so that it is not possible to identify the actual amount of tax paid.


Recent Comments