

Profit shifting of multinational corporations is a pressing topic in the public debate, academic research, and political agenda. The issue of ‘aggressive’ tax planning and cross-border income relocation is, of course, not new to policymakers.
In 2013, the release of the well-known Action Plan on Base Erosion and Profit Shifting (BEPS) by the Organisation for Economic Cooperation and Development (OECD) had lifted the issue to one of the top priorities in international politics. Since then, many nations have implemented far-reaching reforms to prevent ‘aggressive’ income shifting, strengthen anti-tax avoidance legislation, and conserve corporate tax revenues.
While some reforms are part of coordinated supranational actions (for example, the European Union’s (EU) Anti-Tax Avoidance Directive), others are purely unilateral legislation to protect national tax revenues (for example, the French Digital Services Tax).
Prominently, the OECD has proposed a far-reaching two-pillar reform to adjust the worldwide corporate tax system, with discussions now progressing on a global corporate minimum tax of at least 15 per cent.
OECD BEPS Action 11 indicators
Despite the proposed actions to prevent BEPS and the heightened public awareness against ‘aggressive’ tax planning, it is still a major challenge to measure the extent of profit shifting credibly and assess its economic relevance.
In the 2015 published Final Report on Measuring and Monitoring BEPS, Action 11, the OECD introduced six indicators to measure and evaluate BEPS activity over time and on different levels of aggregation. The six OECD BEPS indicators intend to identify the scale and economic impact of BEPS, track changes in BEPS over time and monitor the effectiveness of measures implemented to reduce BEPS.
In conjunction with the introduction, the OECD provides numbers for each indicator up to the year 2012. Policymakers interpret these values in the public debate to provide strong signals on the existence and exacerbation of BEPS.
However, ever since, these indicators have not been revised or quantitatively updated by the OECD.
A critical update
In a recent study, we transparently replicate a selection of the six OECD indicators to update the numbers underlying the ongoing political debate to reform the global corporate income tax system and assess the quality of the proposed indicators.
We show that the main objective of the OECD BEPS indicators of providing understandable and easy-to-replicate measures of BEPS comes at the price of too simplistic measures that prevent a reliable tracing of profit shifting.
We categorise the six OECD BEPS indicators into three different groups based on their underlying data and measurement rationale:
- The first indicator group uses macro data to highlight a potential disconnect between financial and real economic activities. This category comprises Indicator 1: Concentration of foreign direct investment (FDI) relative to the Gross Domestic Product (GDP).
- The second group uses microdata to identify surprisingly low profit or tax measures. This category comprises Indicator 2: Differential profit rates compared to effective tax rates; Indicator 3: Differential profit rates between low-tax locations and worldwide multinational enterprise (MNE) operations; and Indicator 4: Effective tax rates of large MNE affiliates relative to non-MNE entities with similar characteristics.
- The third indicator group uses micro and macro data to measure the use of potential profit-shifting channels. This category comprises Indicator 5: Concentration of high levels of royalty receipts relative to research and development (R&D) spending; and Indicator 6: Interest expense to income ratios of MNE affiliates in high-tax locations.
We revive one indicator from each category to shed light on its development over time. We are confident to focus on the most convincing indicator in each category, namely Indicator 1, Indicator 4, and Indicator 5.
Concentration of FDI relative to GDP
Indicator 1 relies on macro-level data and intends to indirectly measure BEPS that takes place through the use of offshore tax havens.
By replicating this indicator, we transparently show that countries that are often expected to serve as conduits or final destinations for BEPS have a disproportionately high gross or net FDI in relation to economic activity measured by GDP. Extrapolating the indicator values to recent years reveals a stable trend for the relation of average gross FDI to GDP ratios between countries with very high and lower concentrations of FDI relative to their economic activity.
However, since the indicator cannot distinguish between real economic activity and BEPS, the estimates and their variation over time may be driven by factors unrelated to BEPS, such as trade openness or business cycles.
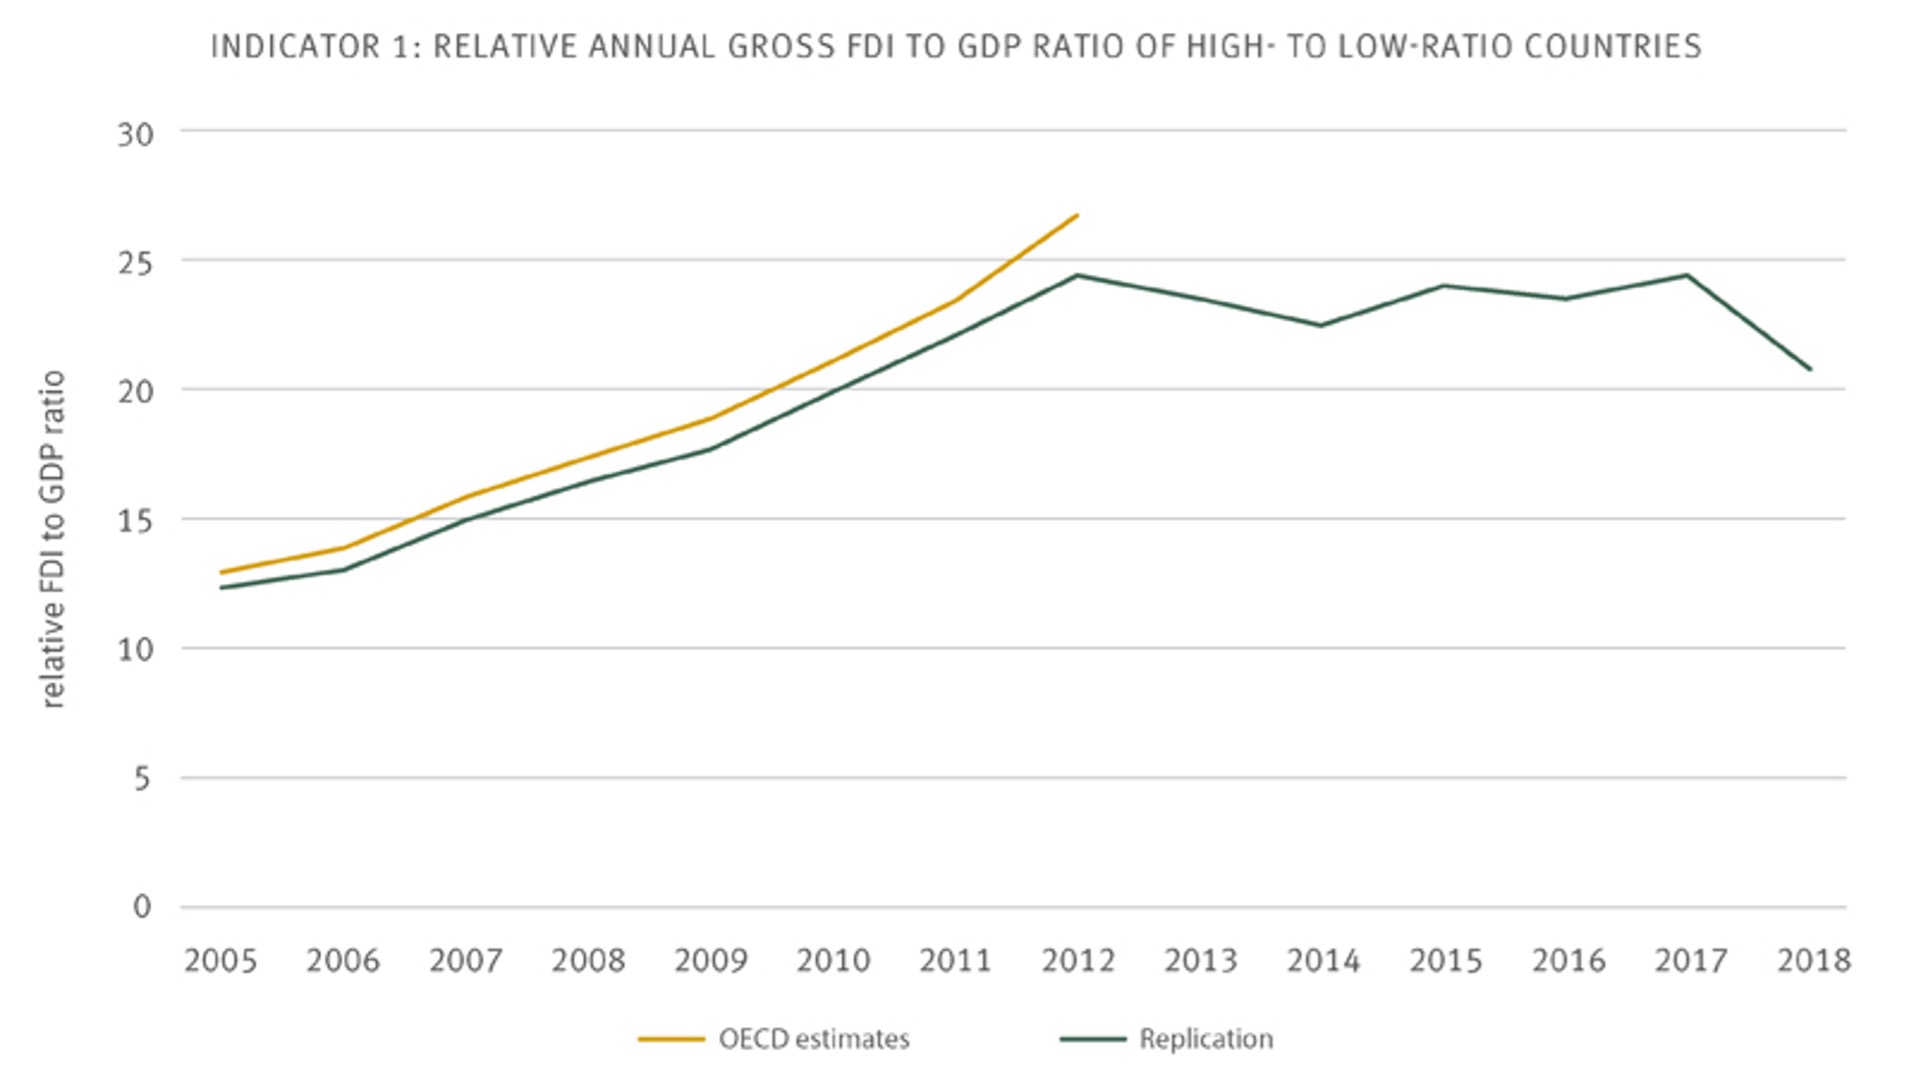
Source: Klein et al. (2021)
Effective tax rates of large MNE affiliates compared to non-MNE entities
Indicator 4 employs firm-level microdata to evaluate cross-border profit shifting of multinational corporations and addresses the well-known drawbacks of highly aggregated macro data. Due to the usage of advanced statistical methods and counterfactuals, Indicator 4 represents the most promising approach.
Replicating the OECD’s regression shows that the effective tax rate differential between MNE and non-MNE affiliates is negative and statistically significant for almost all years in our sample. Yet, the difference diminishes over time. We extend the OECD’s fourth indicator by applying a state-of-the-art propensity score matching approach. This approach identifies close matches of MNE and non-MNE entities based on several observable firm characteristics. The qualitative insight holds. MNEs tend to have lower effective tax rates than comparable domestic firms.
Despite the promising approach to compare MNEs with similar domestic firms, the effective tax rate is by construction not suitable to capture profit shifting. If at all, the recommended measure indicates certain forms of special tax incentives, loss-offsets, hybrid mismatch arrangements, tax negotiations, or other non-profit shifting related methods to reduce a firm’s tax burden.
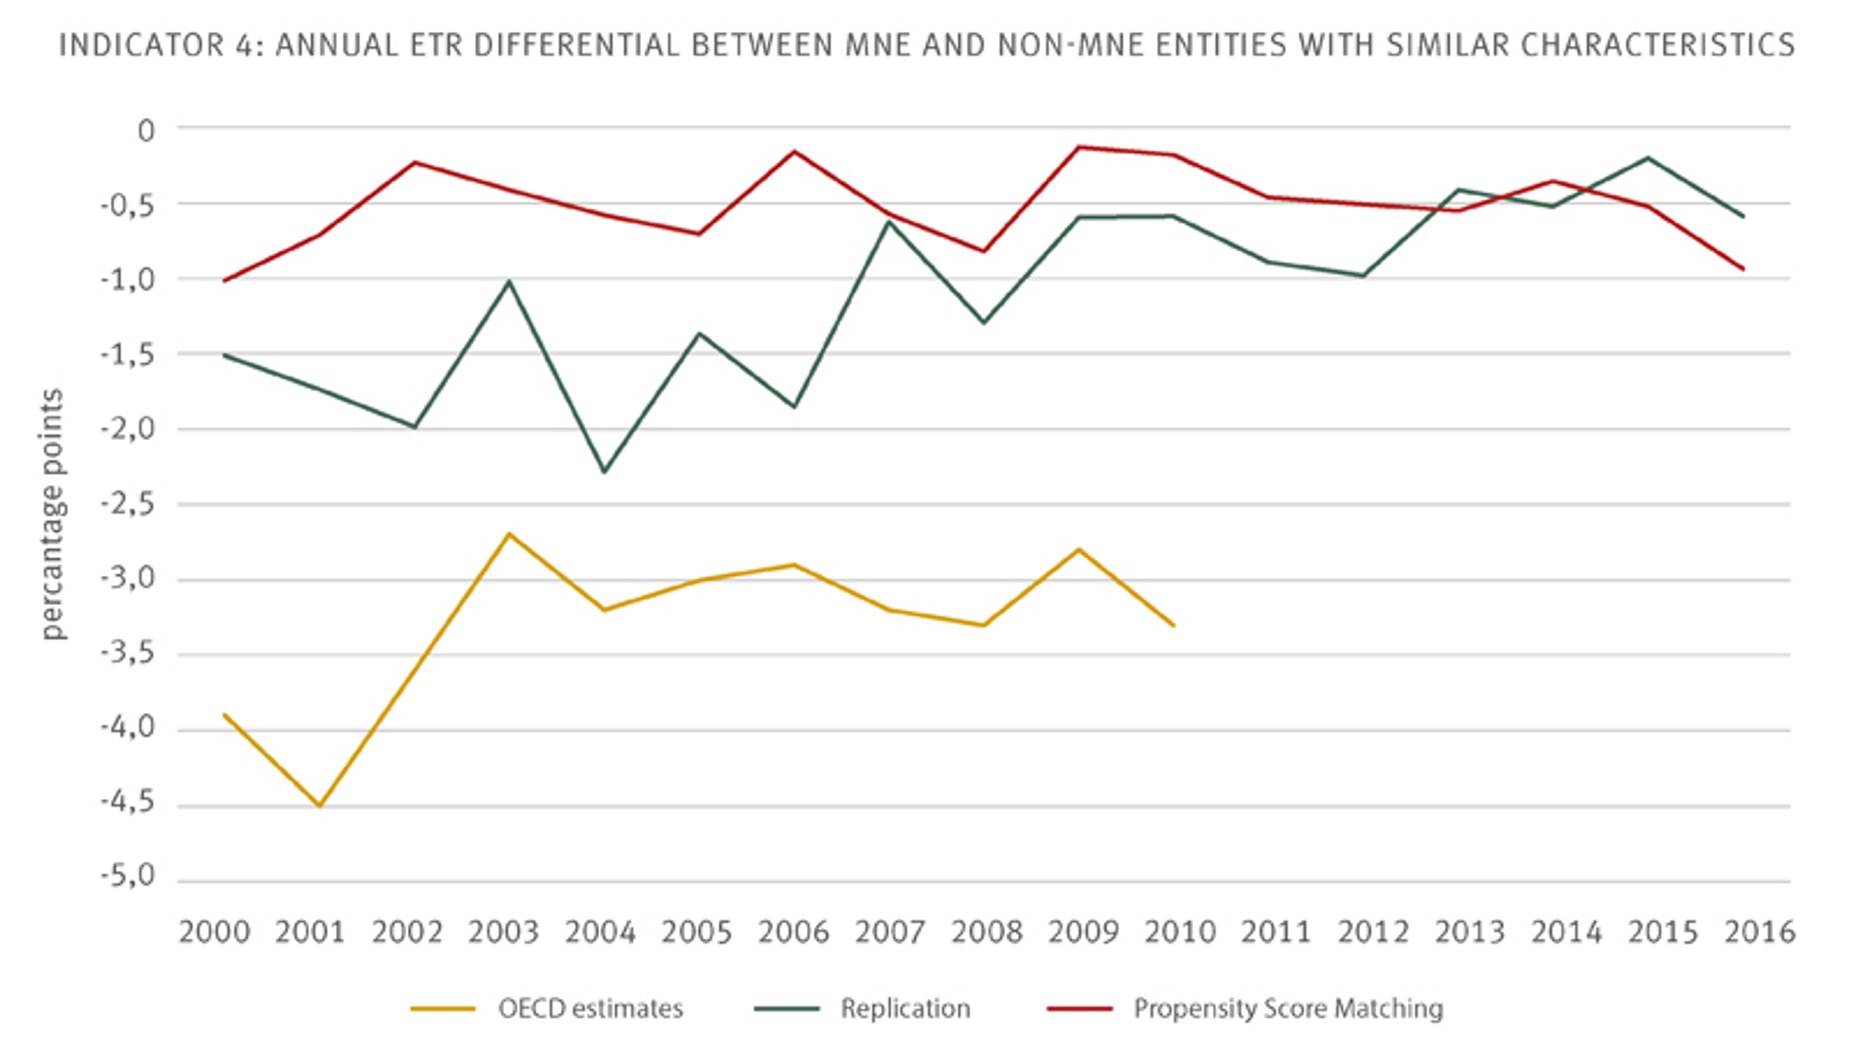
Source: Klein et al. (2021)
Profit shifting through intangibles
Indicator 5 relies again on macro-data rather than firm-level data and is concerned with profit shifting through intangibles.
We show that countries with high ratios of royalty receipts to research and development spending, which builds the rationale of Indicator 5, are countries with low corporate income tax rates or patent box regimes, for example, Ireland, the Netherlands, and Luxembourg. The indicator value remains relatively constant over time and does not seem to react to recent policy actions to curb BEPS.
However, the simplistic design of Indicator 5, which lacks any link to countries’ tax rates, is to some extent arbitrary and completely neglects the potential real economic activities of MNEs.
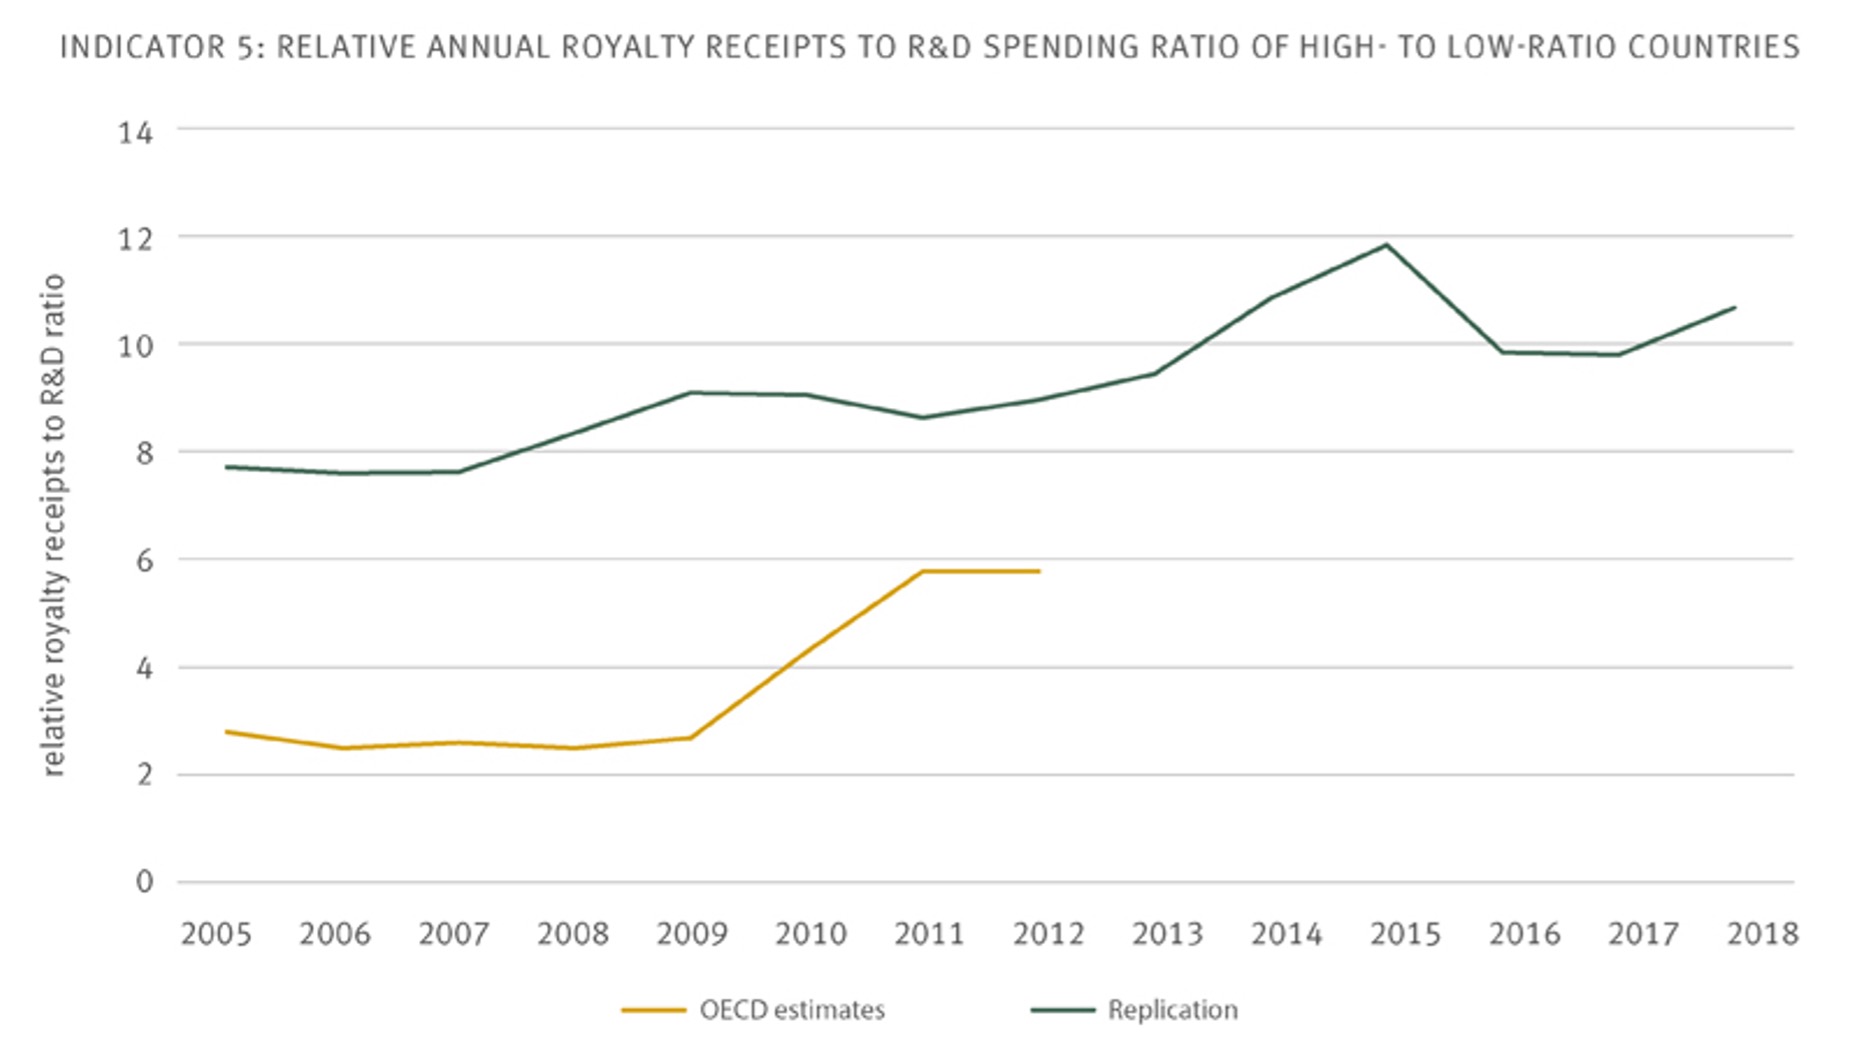
Source: Klein et al. (2021)
New data can provide better measurement
Our analysis shows that despite the OECD’s intention to provide a dashboard of indicators to evaluate the existence and scale of BEPS and to measure and monitor how BEPS evolves, the indicators presented in the Final Report on BEPS Action 11 are unlikely to achieve this goal convincingly.
Their simplistic design comes at the price of making them vulnerable to several confounding factors and economic effects that go beyond profit shifting. The OECD acknowledges several shortcomings of their indicators, and our selected replication of three indicators confirms these issues. Overall, the indicators provide only limited information on the extent of profit shifting and cannot precisely identify any changes to BEPS resulting from recent tax reforms and enactments of BEPS countermeasures. Policymakers should refrain from using these measures as the basis for a policy decision.
We suggest that empirical studies that exploit well-specified identification strategies and granular data should constitute the groundwork to prove the existence of BEPS and develop convincing countermeasures. Especially, the careful evaluation of new data such as public country by country reporting can shed light on the extent of profit shifting. Moreover, separately analysing different profit shifting channels allows to apply targeted measures and data sources and provides a promising approach to evaluate the effectiveness of specific BEPS countermeasures.
Disclaimer
The findings in this article are based on a study prepared for the joint Tax Foundation and European Tax Policy Forum conference, the State of Uncertainty: Reflections on BEPS and the OECD’s Two-Pillar Approach, in November 2020: Klein, Daniel, Christopher Ludwig, Katharina Nicolay and Christoph Spengel (2021), Quantifying the OECD BEPS Indicators – an Update to BEPS Action 11, ZEW Discussion Paper No. 21-013, Mannheim. Available here: https://ftp.zew.de/pub/zew-docs/dp/dp21013.pdf


Recent Comments