

Beyond tax rates, how can we compare tax systems? In a recent policy brief, we reviewed and evaluated some recent efforts to make cross-country comparisons of tax systems, particularly those using indices and rankings to evaluate competitiveness and complexity.
We find that indices are useful in identifying tax reform trends across the world and comparing performance between countries but policymakers should be aware of their limitations and exercise caution in using their findings.
Comparing tax systems not just tax rates
Traditionally, tax rates have been the main indicator used for comparing the competitiveness of country tax systems. Such an approach fails to consider multiple aspects of the tax system. As Slemrod and Gillitzer (2013) argue, ‘tax policy is really tax-systems policy’.
Effective tax policy depends on the interrelationship between different aspects of taxation, including tax rates, tax bases, administration, enforcement and compliance. Think tanks and international institutions have started to account for the multidimensional nature of tax systems and to provide more comprehensive rankings or comparisons of tax competitiveness and complexity around the world.
Some organisations have developed a composite index that aggregates multiple indicators to compare performance of a variety of taxes and administrative processes. A well known example is the report on Paying Taxes authored by the World Bank and PWC. Paying Taxes is part of the World Bank’s flagship Ease of Doing Business Index, but it has gained prominence since its establishment and its findings are published as a standalone report annually.
Other composite indices include the Tax Foundation’s International Tax Competitiveness Index, the LMU Munich and the University of Paderborn’s Global MNC Tax Complexity Project, and the UNSW Business School’s VAT Compliance Burden Index.
There are also indices that focus on comparing national tax systems which are featured in global business studies such as the IMD’s World Competitiveness Yearbook – Tax/Fiscal Policy and the TMF Group’s Global Business Complexity Index – Accounting and Tax.
These indices are popular because they provide a simple and clear way in which national tax systems can be assessed and compared on an aggregate level. They also allow ranking of countries.
Another approach to comparing tax systems is based on surveys of taxpayer perception or experience of systems. Like indices, perception surveys can be designed to produce a simple and clear indicator which compares, for example, what taxpayers think of different countries’ tax system generally. Yet, they do not allow further breakdown into detailed aspects of the tax systems. On the contrary, databases collect large amount of data on multiple aspects of different country tax systems. But they, on their own, do not tell us anything about tax competitiveness or complexity.
What do tax system indices measure and cover?
All tax system indices seek to measure and aggregate a number of facets. Yet, as the idiom says, ‘the devil is in the detail’. The topics covered in and measured by these indices can be quite different.
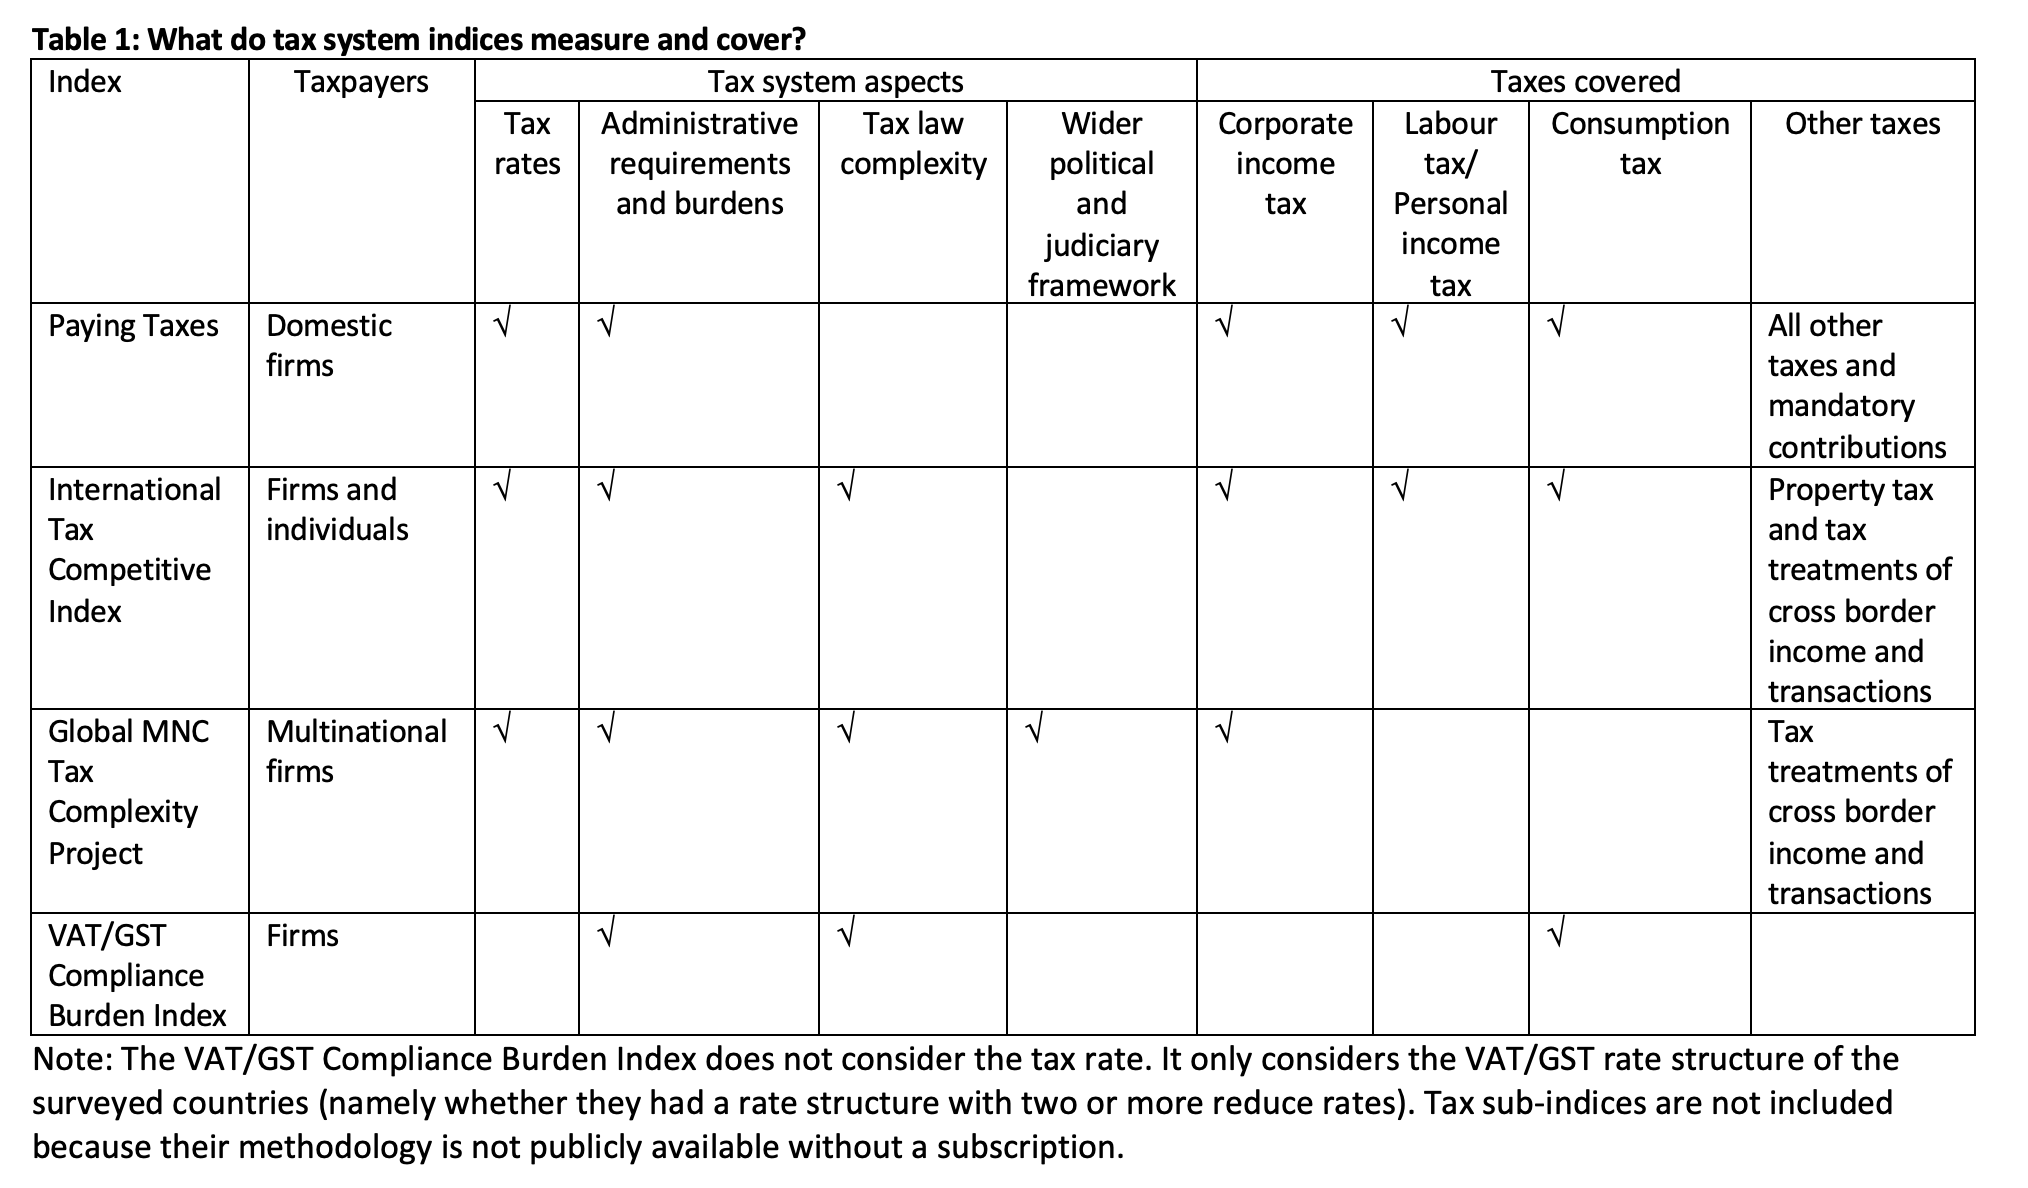
For example, Paying Taxes has four sub-indicators: one is for assessing the level of tax rates in the surveyed jurisdiction and three others for the administrative burden faced by businesses (time to comply, number of payments, and refunds and corrections). It covers not just taxes, but also other government-mandated charges such as social security contributions. It uses a hypothetical firm approach, basing its analysis on a case scenario of a typical medium-size company in the surveyed jurisdiction and then getting a sample of experts who are familiar with the jurisdiction to measure the taxes and mandatory contributions that the hypothetical business must pay, based on the jurisdiction’s laws and regulations, as well as the administrative burden the firm must bear for complying with and paying those taxes and contributions. It does not measure top marginal tax rates.
The International Tax Competitive Index includes five sub-indicators: corporate taxes, income taxes, consumption taxes, property taxes and policies with respect to the treatment of cross-border income and transactions. Similar to Paying Taxes, it considers both tax rates and the administrative burden faced by taxpayers. The survey applies the top nominal marginal tax rate as the basis for its tax rate comparison. It also considers how the tax systems are structured in the surveyed countries, including whether they are neutral between different activities or investments (not favouring some activities over others). A country will score worse on this Index if that country provides incentives to certain industries or activities.
The Global MNC Tax Complexity Project is unique in covering the entire tax policy making and administering cycle, from enactment of tax laws to decisions of the judiciary in tax cases. Unlike other indices, it goes beyond how taxes are complied with and paid. However, it focuses only on the corporate income tax system faced by multinational corporations (MNCs), and does not cover other taxes.
Table 1 below (click to enlarge) summarises the construction of the main tax system indices.
Low correlations between tax indices and rankings
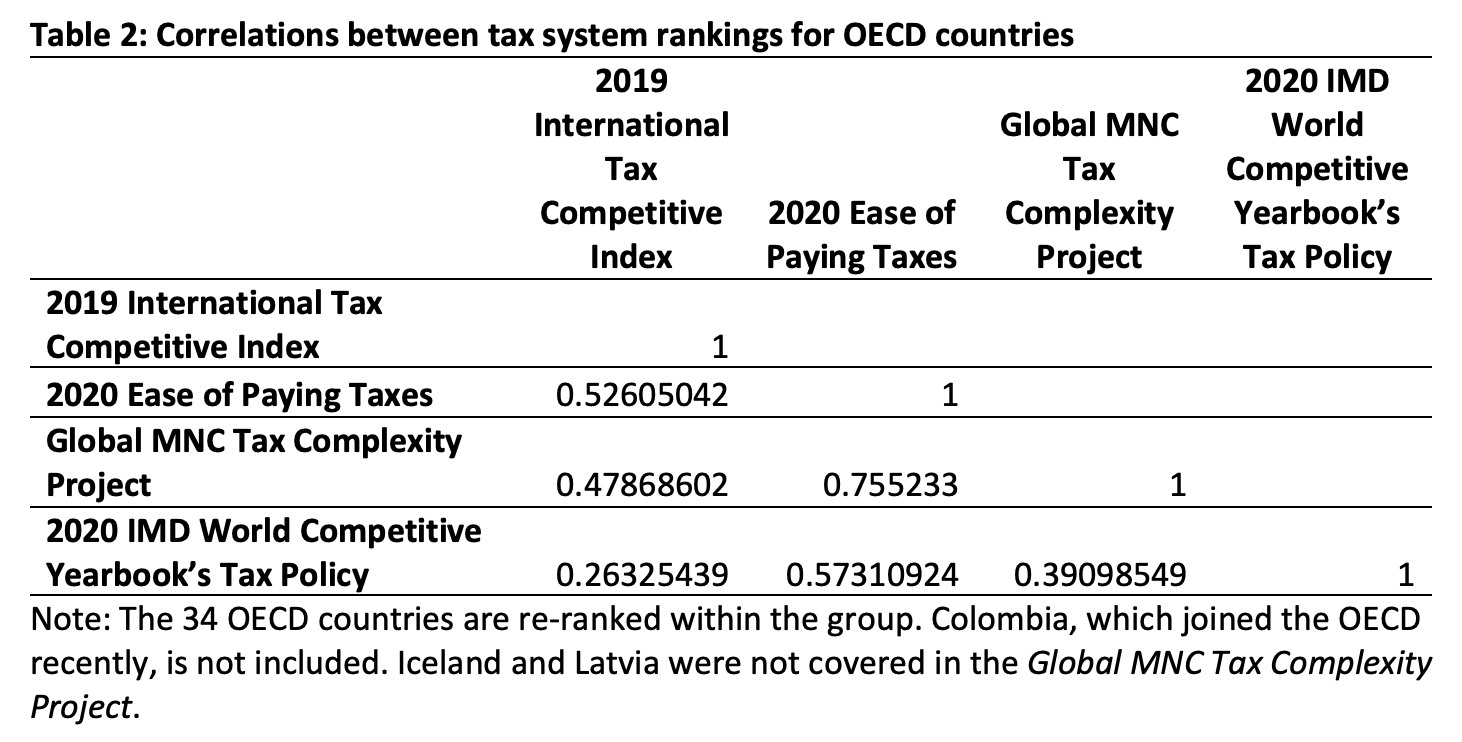
We compared the country rankings of the 34 OECD countries that are featured in the latest publicly available tax system rankings. These countries are ranked in the 2020 Paying Taxes report, the 2019 International Tax Competitive Index, the Global MNC Tax Complexity Project and the 2020 IMD World Competitive Yearbook’s Tax Policy indicator.
Table 2 shows that the rankings of the 34 OECD countries in these four indices have quite low correlation for these four indices. While the indices do measure different things, all of them advertise themselves as being about tax competitiveness in one way or another. The divergence in rankings across indices illustrates the subjective nature of ranking the tax systems of different countries.
The position of various countries within different rankings also varies considerably (see the appendix to our Policy Brief). For example, Australia ranked high in the International Tax Competitive Index (7 out of 36 countries) and the IMD World Competitive Yearbook’s Tax Policy rankings (8 out of 36 countries). But Australia ranks much lower in the Global MNC Tax Complexity Project (no. 26 out of 34) and near the middle in Paying Taxes (no. 17 out of 36).
A contribution to knowledge, but caution required
Tax system indices and rankings are helpful because they summarise large amounts of complex information about a national tax system to aid overall cross-country comparison. However, these indices have important limitations. Research suggests some of the issues are:
- They ignore the particular political, economic and social context of individual countries.
- Ranking and scoring can be misleading, even though they provide a simple, clear point of reference.
- Weights used in assembling the rankings are ad hoc and based on subjective assessments of the importance of various elements of the tax system.
- Indicators may not capture what particular individuals may care about.
- The source of data used to inform the indices is varied and has limitations.
- They may drive ‘unhealthy’ tax competition.
There is no sense in which being ‘number one’ in any of these rankings would automatically equate to having a tax system which is ideal for one’s country. Competitiveness of a tax system tells us very little about how the overall tax and transfer system achieves policy intentions which may include multiple objectives including fairness and equity.
We conclude that policymakers can learn from tax indices but should be cautious in applying the indices and country rankings in them. They should consider the specific context of a country before using the findings of these indices and rankings to support proposals for tax reform.


Then there’s reviewing how well the Progressive Era worked after the 1893-97 depression when most taxes came out of land values until the next depression.
“Not enough economic rent”? But Prosper Australia shows it’s currently running at 50% of the economy but is largely privatised these days. Hence, our impossible land prices. No?
https://www.prosper.org.au/wp-content/uploads/2018/04/TrickleUp22.pdf