

Sin taxes are taxes placed on goods deemed socially undesirable. By raising its price, the expectation is that affected individuals will consume less. Sin taxes address externalities in the form of medical or other costs born partially by individuals different than the ones engaging in the consumption of the good, especially in the context of large government insurance programs. Imposing a tax may help internalise those costs. Furthermore, taxing goods that have relatively inelastic demand is good for revenue generation. In fact, a substantial body of literature has accompanied both the theoretical and empirical implementation of sin taxes and their success in curbing consumption of nicotine and alcohol.
Taxes on sugar sweetened beverages (SSBs) have been increasingly used in the United States. It is still unclear if they have been as successful as nicotine and alcohol taxes when consumers have alternatives. In our article, we examine the Philadelphia sugar sweetened beverage (SSB) tax passed in 2017, and how consumers respond by increasing their consumption of alternative sources of sugar.
Some of the goals of implementing sin taxes have been conflicting in the case of the US. In fact, Chriqui et al. (2020) showed that a reason the soda tax in Cook County, Illinois (which contains Chicago) failed was confusion as to the goal. Most local governments in the US cite health benefits and revenue generation as rationale for passage of SSB taxes. Evaluating these taxes involves understanding the full context as well as estimating any unintended consequences. Once we try to do this, a stark difference arises between previous sin taxes and SSB taxes: neither cigarettes nor alcohol had additional substitutes to the extent that SSBs do have. In fact, it is the case that most foods in many countries have added sugars, and this presents a challenge for the tax as potential avenues of substitution are opened for consumers.
The history and process of implementing SSB taxes in the US
Sodas have been targeted with taxes for their links to overconsumption of calories and other negative health outcomes such as obesity, diabetes, and cardiovascular conditions. Sodas represent the main contributor to the overconsumption of calories, and their formulas produce a lower satiation response compared to other sugary items.
Berkeley first passed a 1 cent per fluid ounce tax on SSBs. Then, in 2017, Philadelphia enacted their own 1.5 cents per fluid ounce tax on sweetened and artificially sweetened beverages, exempting beverages with a substantial share of dairy or natural juice. Since then, 6 additional localities have followed suit. These taxes have been lauded for causing a drop in consumption of SSBs as well as increasing revenues. However, these effects could be mitigated by cross-border shopping, which is when people shop in surrounding localities to avoid the tax. People might also avoid the tax by substituting towards beverages with higher concentrations of sugar due to the design of the policy which levies the tax on the liquid and not on the sugar content. So, while there are benefits to taxing SSBs, it remains a question to what extent tax avoidance behaviour mitigates the decreases in sugar intake.
We studied the public’s response to Philadelphia’s soda tax, on one of those avenues of substitution. Namely, we consider whether people began eating more sugary foods in response to the tax since foods were not included in the SSB tax. We find evidence of increased sugary food consumption as a response to the tax.
Results
Our analysis is the first of its kind in the United States. Previous studies have not had data that allowed them to study this response to the tax. They relied on calibrating structural models with responses to food taxes to infer elasticities, or they had evaluated changes in consumption on sodas without examining the potential substitutes.
We use data from Nielsen1 which provides weekly point-of-sale data from select stores on all items sold that week in the store. According to the American Economic Association, the Nielsen data has ‘more than half the total sales volume of US grocery and drug stores and more than 30 percent of all US mass merchandiser sales volume.’ We then implemented a web scraping to determine nutrition facts of those Universal Product Codes (UPCs). Our final dataset had 11,181 unique items and 563.8 million reports. These data can help shed light on this topic because it shows what items people are buying and because it is one of the largest datasets available. We study 9 specific types of food which are important contributors to negative health outcomes in the US according to the American Heart Association (AHA). Figure 1 shows the number of transactions, the amount of sugar, and the concentration of sugar for each group.
Figure 1: Number of transactions, the amount of sugar, and the concentration of sugar for each group.
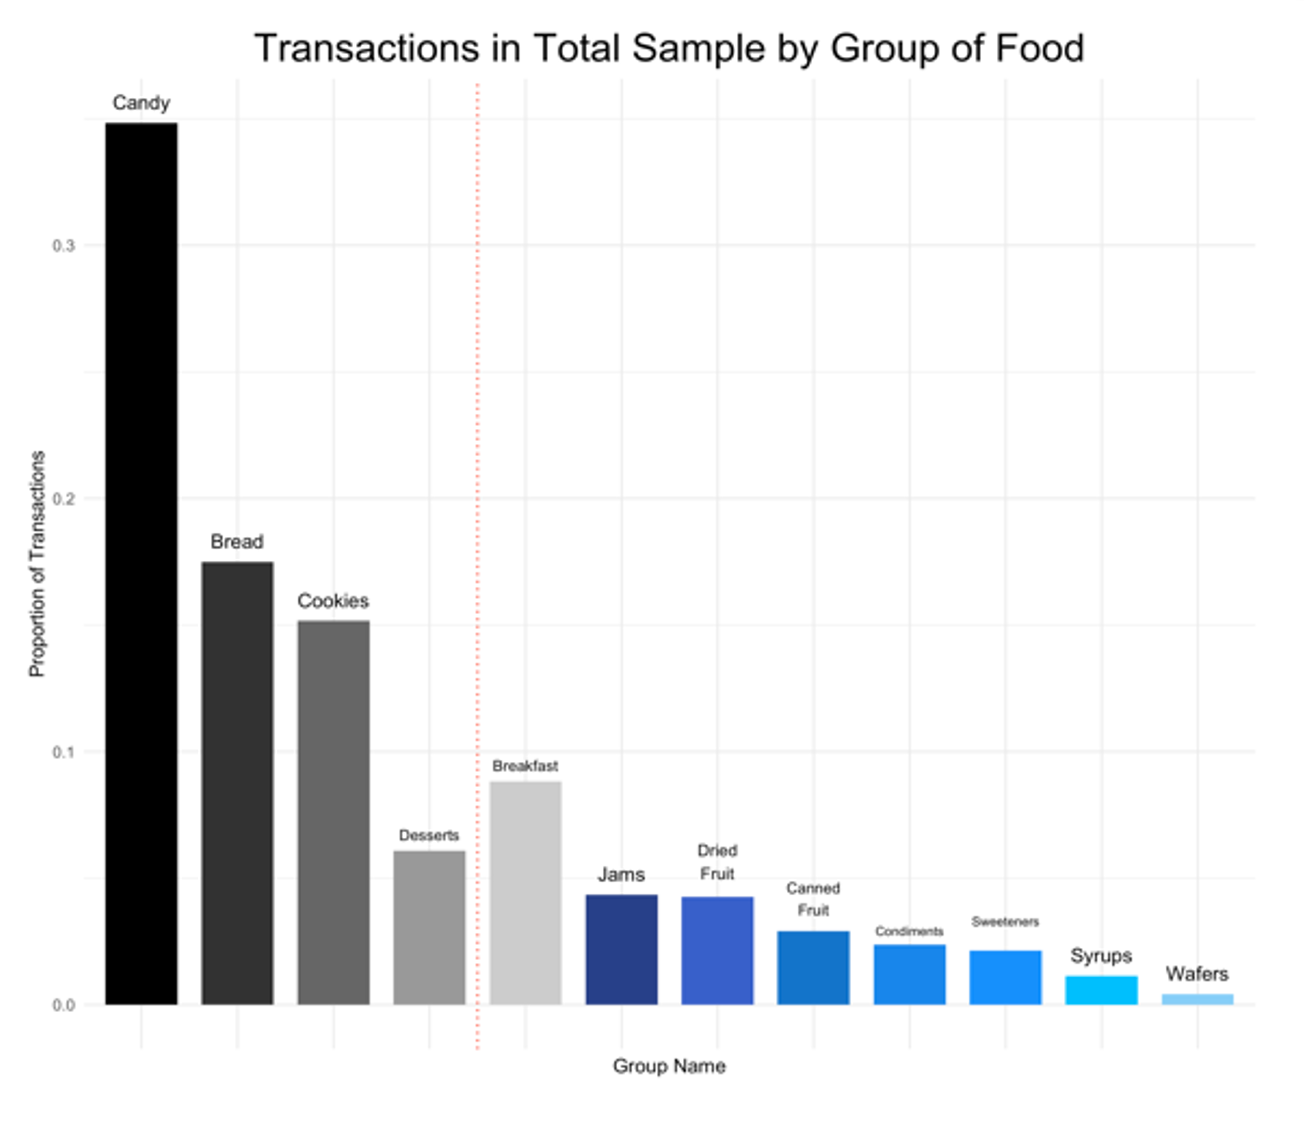
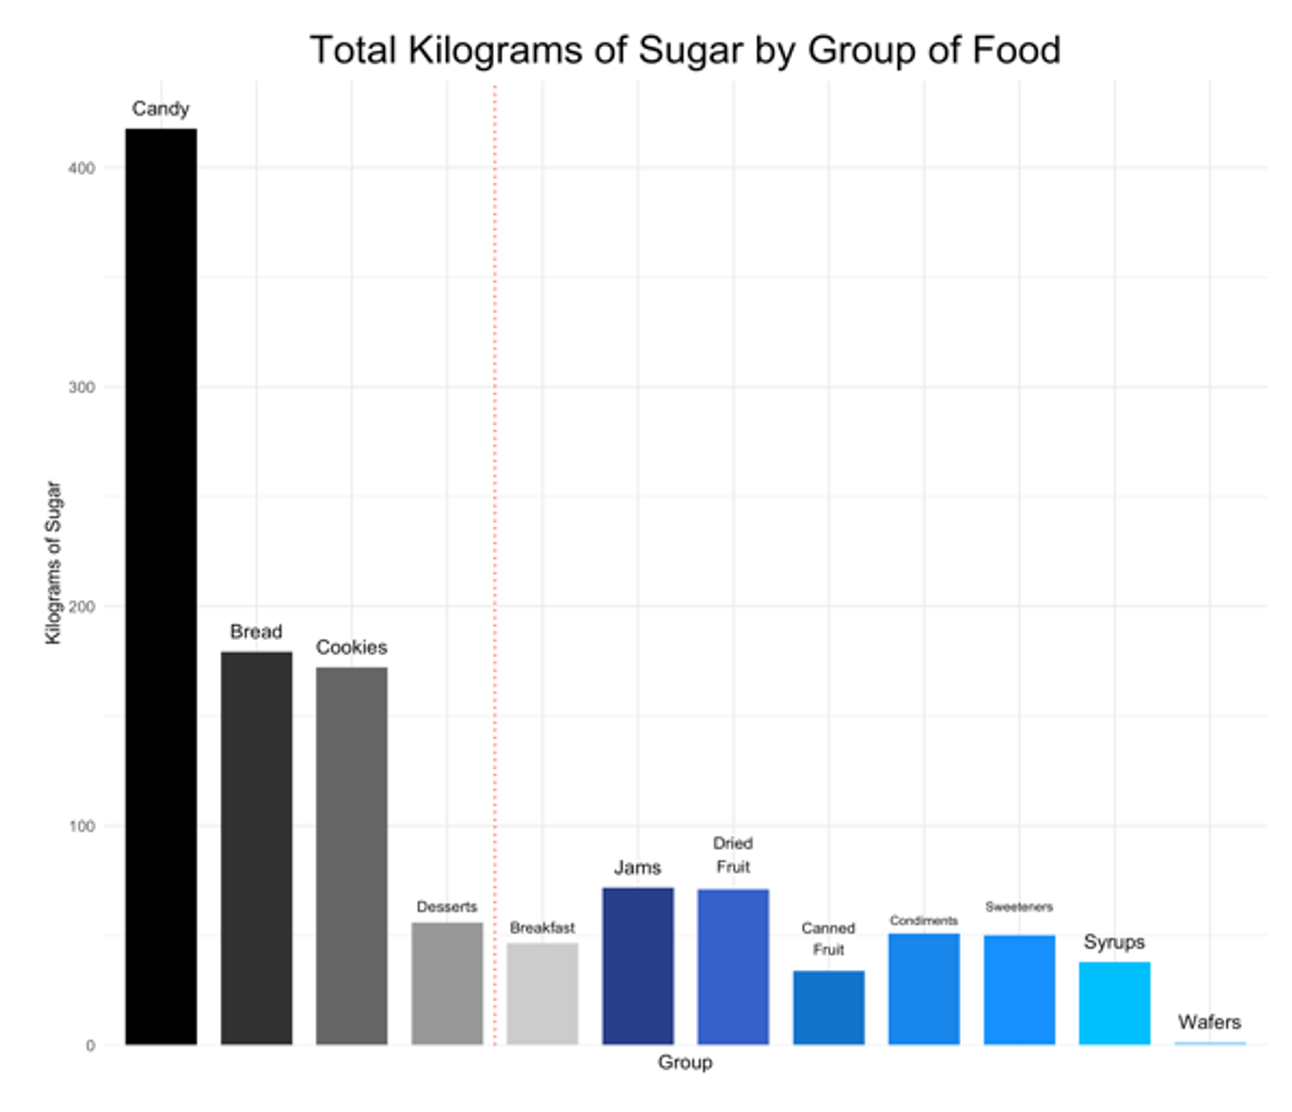
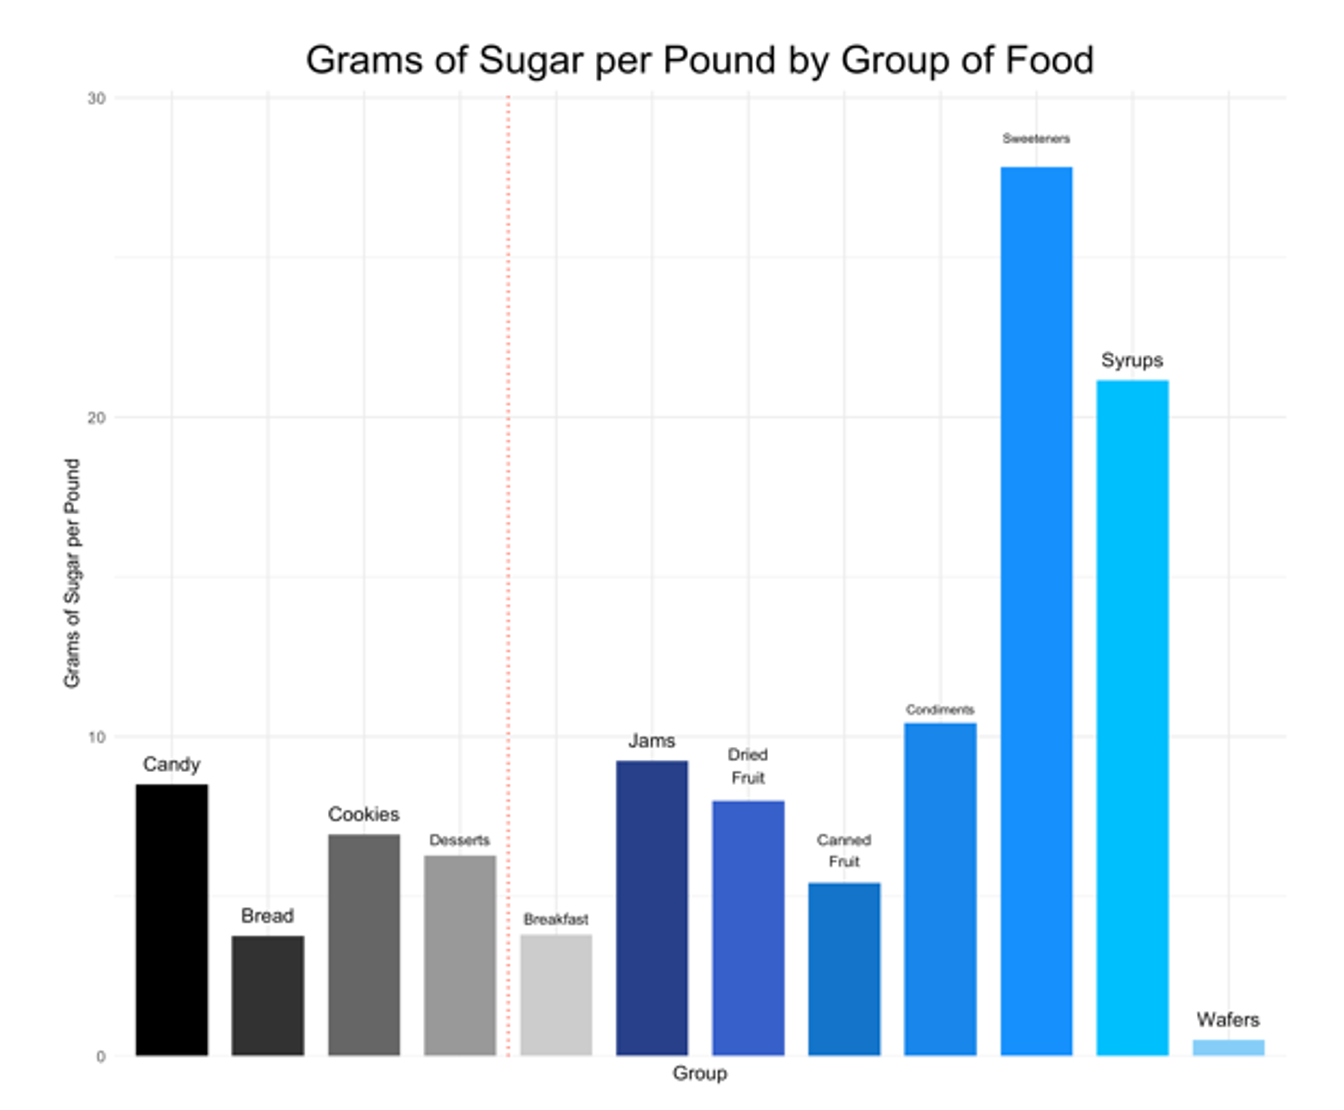
Note: The red line distinguishes the main 4 groups (Candy, Breads, Cookies and Desserts), their contribution in sugar and number of transactions accounts for more than 80% of the total.
We use a difference-in-differences technique. To bolster confidence in this strategy, we use different control groups which sometimes exclude border counties which have been shown to be affected by SSB tax policy. In fact, in alternative exercises we find that consumption of other sweetened foods also increases in neighbouring counties.
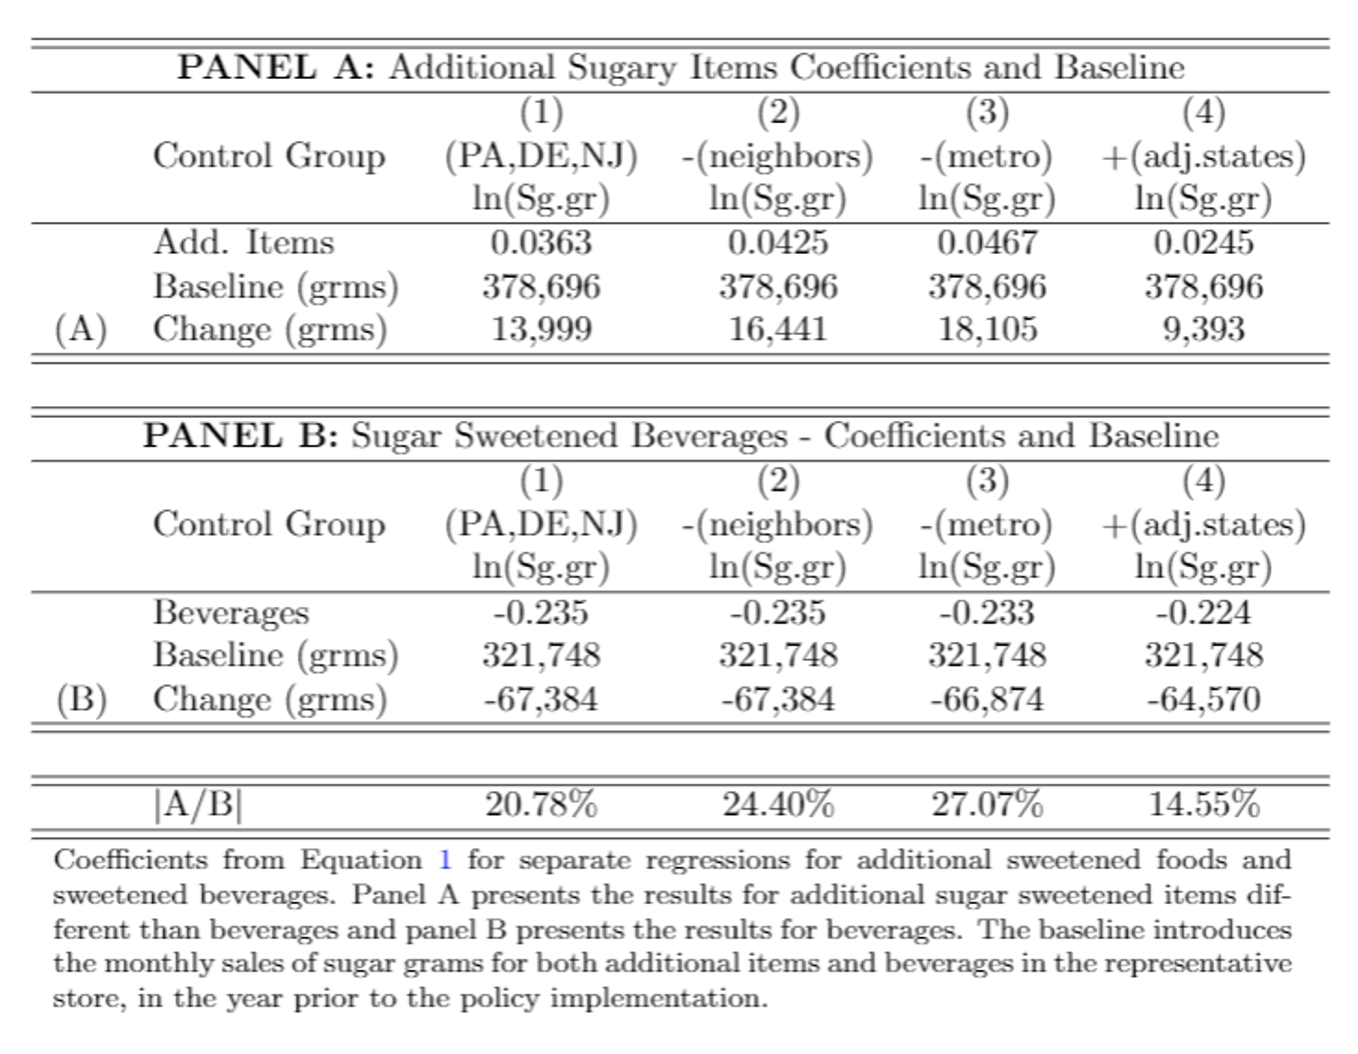
Figure 2 shows that we estimate a 3.6% increase in sugar grams consumed from sugary foods following the SSB tax in our main specification as well as the estimates from specifications with three other control groups. Table 1 puts those estimates into context by comparing to the reduction in sugar from SSBs. The increase in sugar intake from additional sweetened foods offsets approximately 20% the reduction in sugar intake from beverages. This is an economically significant amount of leakage that could affect local government’s ability to enact these taxes and attain the promised improvements in health outcomes downstream. We do several subgroup analyses and do not find a consistent pattern of substitution within specific food groups.
Figure 2: Change in sugar purchases from additional sugary foods.
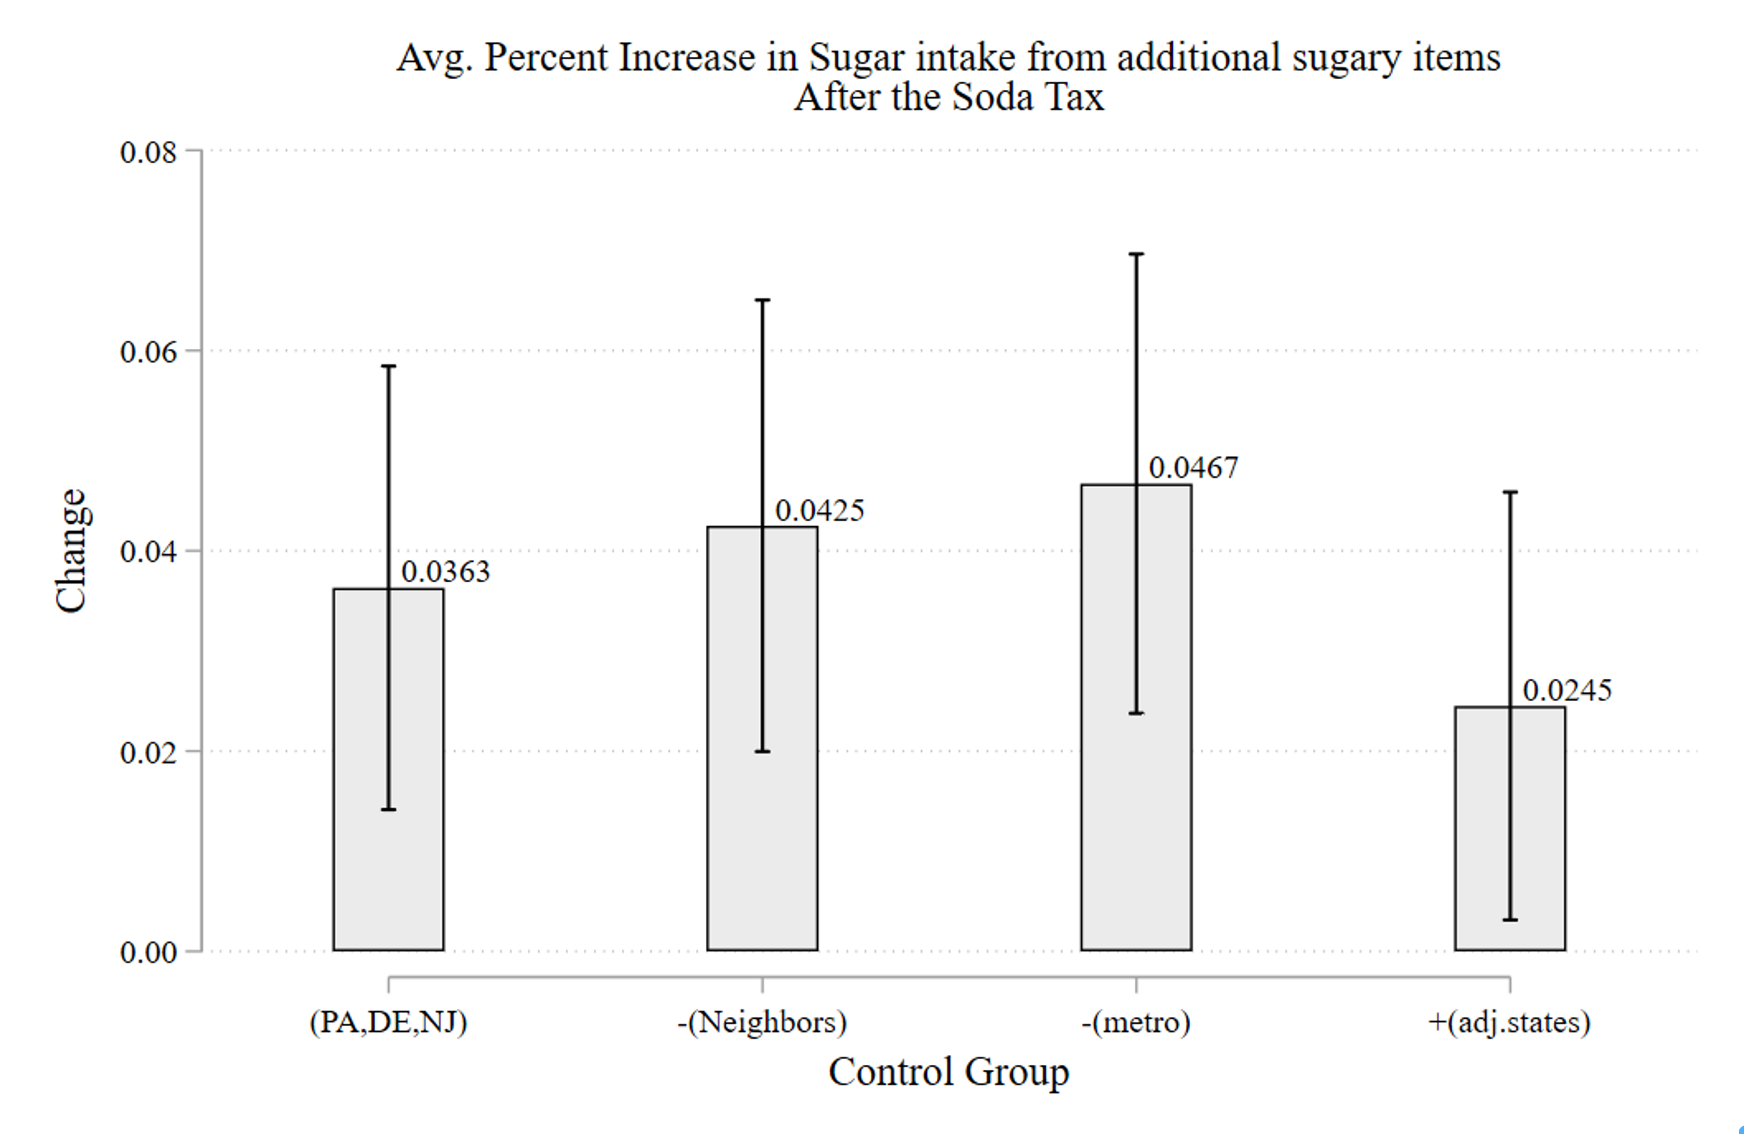
Note: The comparison groups use as counterfactual are, from left to right: (PA, DE, NJ) all localities in the three states; – (Neighbours) removes neighbouring localities to Philadelphia; -(metro), removes the Delaware Valley area localities; +(adj.states), adds localities from neighbouring states.
Table 1: Net Change in Sugar intake from comparing effect on Soda purchases
 Looking Forward
Our study shows the importance of evaluating additional margins of substitution after the passage of a soda tax, and how difficult it is to influence consumer behaviour in the presence of additional potentially harmful substitutions. We find that approximately 20% of the reduction is offset by substitution to sugary foods. Additional sources of substitution exist including cross-border shopping and switching to higher concentration beverages. A full evaluation of SSB taxes must include these substitutions.
What does this result entail for using taxation policy to influence consumer behaviour? We must differentiate short and medium-term responses from long term responses regarding the substitution to foods. In the case of tobacco, the ‘addicted’ population substituted towards more intense smoking as a response. However, tobacco use is much less widespread than when the taxes were first imposed. Something similar could happen in soda. People need to get their sugar back because it is part of their consumption routine, and they are substituting to alternatives. This should raise a flag, but in the long run we still don’t know if the substitution is permanent or temporary.
Without waiting for the long-term results, the policy could be tailored to tax added sugar, instead of an individualised food, or group of foods, with no regard to the harmful substance. A tax on liquid creates a world in which 1 gram of sugar is equally taxed as 40 grams of sugar. In fact, the UK has enacted a tax that varies the amount of the tax according to the concentration of sugar: drinks with a concentration of 8 g of sugar per 100 mL are taxed at £0.24/L and drinks with sugar concentration between 5 to 8 g per 100 mL are taxed at £0.18/L. Drinks with less sugar are not taxed. If manufacturers respond to the tax bunching, and their behaviour can be influenced, maybe there are ways of designing the tax to destroy less wealth in terms of sales and employment. There is still little evidence on potential manufacturer responses, however.
Finally, the cross-border shopping result is key. Small and local governments are in a worse position to enact these taxes and successfully affect consumers behaviour because cross-border shopping is so much easier. Perhaps this could be mitigated if a government that covers a larger area enacts the tax. We expect that our study informs policymakers as well as advocates and industry of the potential consequences of these taxes.
1Researcher(s) own analyses calculated (or derived) based in part on data from The Nielsen Company (US), LLC and marketing databases provided through the Nielsen Datasets at the Kilts Center for Marketing Data Center at The University of Chicago Booth School of Business. The conclusions drawn from the Nielsen data are those of the researcher(s) and do not reflect the views of Nielsen. Nielsen is not responsible for, had no role in, and was not involved in analysing and preparing the results reported herein.


Recent Comments