

The analysis of wealth distributions has gained more and more attention around the world over the last decade. A high concentration of wealth can negatively affect growth and innovation, and raises concerns about an unequal distribution in welfare.
The analysis of wealth inequality is typically conducted with representative survey data or data from tax authorities. If researchers aim to compare the distribution of wealth across countries, individual pension wealth challenges the comparability of wealth data. Private pension wealth is often included in the analysis of wealth, while individual public pension entitlements are not. The concept of augmented wealth, which is defined by the gross value of financial and non-financial assets plus private and public pension wealth entitlements minus the total amount of debts, contributes to a transparent cross-country comparison incorporating a more reliable measure of economic wellbeing.
An Australian study
In my paper, I explore the evolution of augmented wealth in Australia between 2002 and 2018. Aside from the international comparison of wealth inequality, the concept of augmented wealth is also well suited for an assessment of Australia’s main pension schemes, which include the social security pension system, Age Pension, and the private pension system, Superannuation. The latter is especially of high interest to economists, as it represents the ’Australian way’ to guarantee the standard of living for future retirees. The scheme gained significant importance in 1992 when the Australian Government introduced compulsory contributions by employers to the employees’ superannuation accounts as an addition to the established, tax-funded Age Pension. My analysis provides a deeper understanding about the establishment of the Superannuation scheme, its interaction with the Age Pension scheme, and its distributional consequences.
I use the Household, Income and Labour Dynamics in Australia (HILDA) survey, which includes information on private wealth at the household level between 2002 and 2018. Furthermore, it includes exhaustive pension information at the individual level. This is particularly important to help estimate the value of the social security pension wealth, which is defined as the present value of discounted income flows from social security pensions. In other words, the value considered as social security wealth is the actuarially fair, discounted price to which an individual would sell their social security pension claims on a complete capital market.
Superannuation helps increase retirement wealth
My analysis shows large increases in augmented wealth during the period, from on average AUD 668,306 in 2002 to AUD 1,009,149 in 2018, which are driven by rising housing values, accompanied by a relatively high homeownership, and considerable gains in superannuation accounts. Wealth gains are the most profound for households with a household head over 50 years of age. Social security pension wealth, stemming from Age Pension, remains relatively constant over time, on average between AUD 70,000 and AUD 80,000, and it is the most important wealth position for households at the lower end of the wealth distribution. Conditioning wealth on several household characteristics, I also find that couples hold considerably less social security pension wealth and hold more superannuation wealth. Women seem to hold less superannuation wealth in retirement, and homeowners are also better off in terms of pension wealth.
The distribution of wealth owned by private households remained relatively stable during the 2000s, but inequality slightly increased in the 2010s. This can be seen in Figure 1, showing the percentile ratios between the 90th percentile and the median for net worth and augmented wealth. Both aggregates reveal increasing ratios during the 2010s, which means that households at the 90th percentile owned up to 4.7 (3.6) times more net worth (augmented wealth) than the median household in 2018. The figure also shows the equalising effect of pension wealth, as the ratio is smaller for augmented wealth.
Figure 1: Percentile ratios between the 90th percentile and the median for net worth and augmented wealth
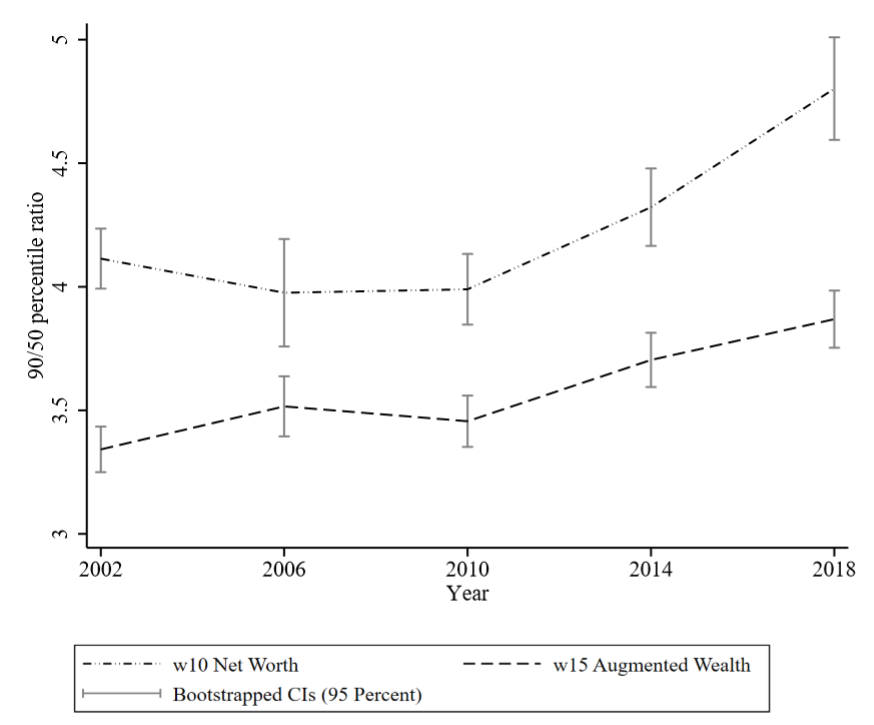
Notes: Own calculations based on the full sample. The panel provides the 90/50 percentile ratio over time. Bootstrapped standard errors are based on 1000 replications
Source: HILDA Survey.
The interaction between Superannuation and Age Pension triggers behavioural responses
My study finds suggestive evidence for behavioural responsiveness from the interaction between Superannuation and Age Pension. Individuals dissave superannuation accounts faster when they are eligible, or almost eligible, for Age Pension. Among other reasons, this can be driven by consideration of superannuation wealth in the income and asset test. I argue that this may lead to inefficient retirement decisions, which I discuss in the paper. Furthermore, I raise concerns as to whether the retiree population will diverge between those depending on Age Pension and those relying on Superannuation in the future.
Age pension reduces wealth inequality in Australia, but less so compared to other countries
Finally, I compare my Australian analysis to Germany, Switzerland, and the United States, which have been analysed before. I find that Australia exhibits relatively high values of net worth, but relatively low values of pension wealth, which also translates into the distributional analysis. The table below provides the Gini index of the wealth aggregates. The index incurs values between 0 and 1, with 0 describing total equality.
Inequality in net worth is the lowest for Australia in this set of countries. However, adding the pension wealth aggregates reduces inequality in all countries, but lesser in Australia. Augmented wealth in Australia has a Gini index of 0.592, higher than in Germany (0.508) and Switzerland (0.550).
Table 1: The Gini indices of different wealth aggregates in Australia, Germany, Switzerland and the United States
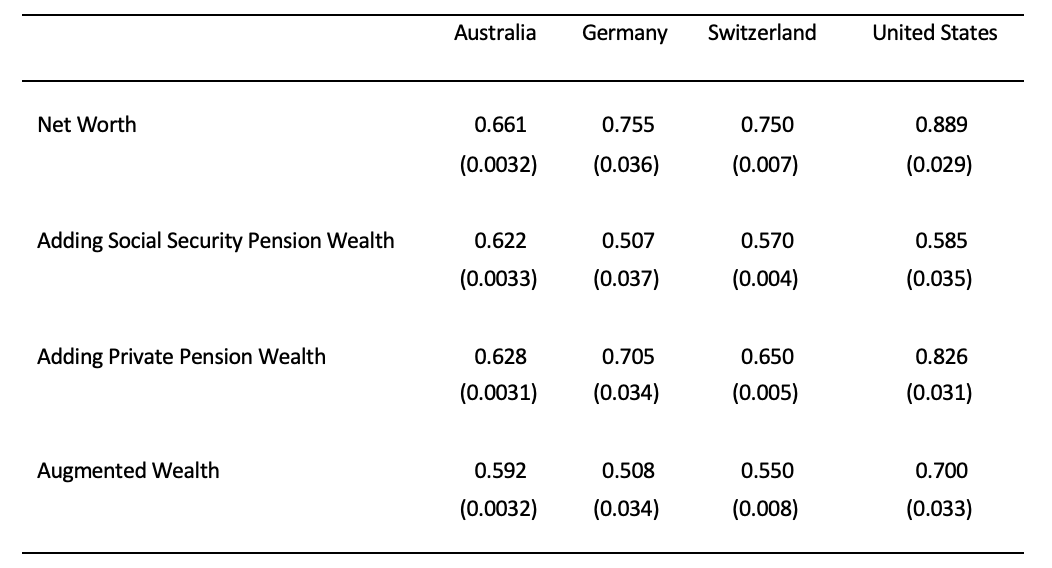
Notes: Results from Australia are based on own calculations in 2014. Bootstrapped standard errors in brackets using 1000 replications
Source: HILDA Survey wave 18. German and US estimates are based on SOEP v30/v31 and SCF 2013. Results from Switzerland are based on the EU-Silc.
Even though the concept of augmented wealth enhances the comparability of wealth data, this kind of international comparison needs to be treated with caution because differences in wealth surveys and pension schemes require several assumptions. Nevertheless, my study shows that the inclusion of pension wealth seems important for the distributional analysis of household wealth.
In conclusion, my article represents a first analysis of the Australian pension schemes and their interaction with augmented wealth, leaving room for further assessments in the future.
Further reading
Longmuir, M 2021, ‘Fair Crack of the Whip? The Distribution of Augmented Wealth in Australia from 2002 to 2018’, Working Paper no. 04/2021, Melbourne Institute: Applied Economic & Social Research, University of Melbourne, Melbourne.


Maximilian, I will read your paper with great interest. I have two problems with your paper, based upon your start point – HILDA. It is a great data source, to be sure, but by its very nature – a survey of a tiny fraction of households – it is not capable of estimating accurately the wealth at the upper end of the wealth spectrum – the last few per cent. This is important because so much wealth is concentrated there, and is largely immune from taxation. Have you looked at the differences between the estimates of wealth in HILDA, the Survey of Income and Housing (Household balance sheet) and the National Accounts? The different estimates of the net worth of households is staggering – yet no one seems to notice. At the last point of relatively direct comparability (2018) the gap was $0.5 trillion between HILDA and the SIH estimate, with a further $0.7 trillion to the adjusted National Accounts estimate, or a further $1.3 trillion to the unadjusted National Accounts estimate (see ABS 6553.0). This wealth is not at the bottom or the mid point of household distribution. There are other structural reasons HILDA under-estimates, which I would be happy to discuss. And congratulations on your approach to estimating the wealth value of government pensions – a valuable contribution. Two further points: (1) the pensions of Government retirees – public servants and the military – should be valued the same way – I am certain the results would be eye-watering (but the analysis needs to account for the Future Fund); (2) there needs to be a risk premium taken into account in the DCF for government pensions as they have a degree of certainty privately funded pensions certainly do not. I expect you have addressed such issues already. Kind regards, Joe Roach