

In the mid-1990s Martin Feldstein, economics professor at Harvard University and perhaps the most Nobel-worthy public finance economist not to receive the prize (he died last year), introduced a new concept to measure how taxpayers’ behaviour responds to tax rate changes. This is the ‘elasticity of taxable income’ (ETI). It measures the proportional change in taxable income (for an individual or well-defined group) in association with a given proportional change in a marginal income tax rate measure. (Feldstein proposed ‘one minus the marginal tax rate, 1 – t, rather than t, so that the ETI is expected to be positive).
By focusing on taxable income, the ETI concept encapsulates numerous behavioural changes in response to a tax rate change that are reflected in taxable income changes. This potentially includes changes in labour supply, tax evasion, salary negotiation outcomes, income splitting, or where incomes are shifted towards tax-favoured forms.
Several methods have been used to estimate ETIs empirically, leading to a range of estimates for numerous countries. The literature review by Saez et al. (2012) identified over a hundred studies. One approach, proposed by Saez (2010) and Chetty et al. (2011), exploits the observation that taxpayers often seem to bunch at income thresholds above which the marginal tax rate increases in a multi-rate income tax system. This leads to an observed distribution of taxable income across taxpayers in which there is an ‘excess mass’ (disproportionate number of taxpayers) or ‘spike’ around some or all tax thresholds.
Intuitively, this suggests that taxpayers’ choices of how much taxable income to earn and declare around those income levels are sensitive to the nearby change in tax rates. An ETI estimate is obtained from the excess mass measure of responsiveness and the difference in tax rates across the relevant threshold. A number of studies have applied the Saez-Chetty method to obtain ETI estimates, with results suggesting that this approach can overcome a number of weaknesses of previous methods.
Our study
Our recent application of this method in Alinaghi et al. (2020) is motivated by two factors. Firstly, there are no previous ETI ‘bunching estimates’ for New Zealand. Secondly, almost all previous ETI bunching studies relate to individuals’ tax rate responsiveness, ignoring the fact that where families contain more than one taxpayer, partners may coordinate how their incomes are earned and/or declared for tax purposes, in response to the marginal income tax rates that they each face.
In Creedy and Gemmell (2019) we showed that, where income taxes are levied at the individual level (as in Australia and New Zealand, but unlike the system of joint income taxation for married taxpayers in the United States), the ETI is expected to be larger for partnered individuals than for single individuals. Importantly, when a higher earner within a couple faces a higher marginal tax rate, the response of the couple may include a reduction in taxable income by the higher earner (as expected for singles), but also an increase in taxable income for the previously lower-earning partner.
For example, the introduction of a new top rate of income tax could induce partners to respectively reduce and increase their taxable incomes (from above and below the new threshold) to relocate at or close to that threshold. It is this greater extent of bunching by partnered taxpayers in response to marginal tax rate differences within the New Zealand income tax system that we sought to identify in Alinaghi et al. (2020).
We explore this aspect using a large administrative unit-record dataset on taxable incomes for the New Zealand taxpayer population over the period 2001 to 2017, with individuals matched to their partners using population census data. We focus in particular on taxpayer bunching around the top threshold of $60,000 over 2001-2008 ($70,000 during 2010-2017), where the marginal tax rate increases from 33 to 39 per cent (30 to 33 per cent during 2010-2017).
Findings
The results provide strong evidence that excess mass and ETIs are indeed larger for partnered individuals compared with single individuals. An illustration of the excess mass around the top tax threshold or kink for New Zealand is shown in Figure 1 below. This is based on self-employed taxpayers (in 2013), who are known to have greater ability to respond to tax rate differences. It is clear that there is sizable bunching around the kink by both (single and partnered) groups, but much more bunching by partnered taxpayers than by singles. This, in turn, generates a higher ETI for those partnered individuals.
In addition, we suggest that, where constraints on income sharing among partners are relatively weak, larger elasticities can be expected for couples where both partners are observed in the same income tax bracket. The New Zealand evidence also strongly supports this argument and is consistent with known characteristics of the New Zealand income tax system that imposes relatively few constraints on intra-family income sharing.
When considering all taxpayers combined, ETI estimates are within the range of values commonly found in studies for other countries, of around 0.14 to 0.4. But whereas ETIs for single taxpayers are around 0.14, values for partners individuals are twice as large on average. To put these numbers in context, at New Zealand’s current top tax threshold of $70,000 the tax rate rises from t = 30 to 33 per cent; hence (1 – t) falls from 70 to 67 per cent. With those tax rates, an ETI of 0.4 implies that a taxpayer who would otherwise declare a taxable income of $72,000 (were the 30 per cent rate to apply above $70,000), would instead declare around $70,750 when a 33 per cent rate applies instead. That is, approximately a 2 per cent reduction in their taxable income, which in this case puts them close to the tax kink.
Decomposing ETIs across taxpayer types, Alinaghi et al. (2020) find that ETI estimates for wage-earners are small for both single and couple taxpayer groups, at around 0.06. This conforms with previous estimates for wage-earners subject to withholding tax and/or third-party reporting. Such individuals, whether partnered or not, have limited opportunities to respond to tax rate differences. By contrast, estimates for the self-employed suggest relatively high elasticities, particularly for self-employed taxpayers who have partners: at 0.80 for singles and 1.08 for partners. These also appear to be especially high for self-employed individuals where partners are observed to earn income in the same tax bracket, with a large ETI estimate of 1.3 on average.
These substantive differences in ETI estimates for singles and couples suggest that in attempting to understand the mechanisms, opportunities for, and constraints on, taxpayers’ responses to income tax kinks, it may be crucial to consider family structures and the ease with which incomes of different family members can be earned and allocated within the family. The ETI is not only a valuable measure of responses to a prevailing tax structure and its changes, it is a crucial factor in the design of those structures. Importantly, although this aspect has received relatively little attention, it also influences the nature and extent of compliance-enforcement policies.
Figure 1: An illustration of an ‘excess mass at a tax kink’. Estimation for the New Zealand income tax for self-employed taxpayers in 2013.
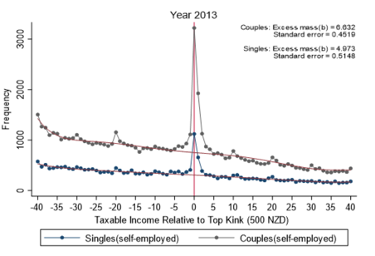 The vertical axis measures the frequency of taxpayer numbers; the horizontal axis measures taxable income in bands of ±$500, relative to the top taxable income tax kink (= $70,000).
Reference
Alinaghi, N., Creedy, J. and Gemmell, N. (2020) Do couples bunch more? Evidence from partnered and single taxpayers in New Zealand. Working Papers in Public Finance, No. 02/2020. Victoria School of Business and Government, Victoria University of Wellington, New Zealand.


Recent Comments