

Since the introduction of the New Tax System (Goods and Serivces Tax) Act 1999, there have been several reviews on Australia’s income tax system (see e.g., Henry et al. (2010)). The progressivity of the tax system plays a centre role within these reviews as it is directly linked to the equity and efficiency implications of the tax system.
There is a common view that Australia’s income tax system is too progressive. In response, in budget 2018-19 the Liberal Government proposed a seven-year Personal Income Tax Plan, which aims to provide tax relief for low and middle income earners, combat bracket creep, and simplify and flatten progressive income taxes. The Treasury Laws Amendment (Personal Income Tax Plan) Act 2018 gives effect to the Government’s Personal Income Tax Plan.
The political battle lines have been drawn over the tax cut plan since the federal budget 2018-19. It will be again a hot topic in the upcoming federal budget and election. However, there is little evidence on measuring tax progressivity in Australia. How progressive is Australia’s income tax system? How has it evolved over time since the Goods and Services Tax Act 1999?
Answering these fundamental questions is important for evidence-based debate on budget and tax reforms in Australia. In our recent research, Tran and Zakariyya (2019), we aim to provide a simple statistic to gauge and monitor the progressivity level of Australia’s personal income tax system over time.
Tax progressivity (Suits) index
The progressivity level of an income tax system can be measured by a tax progressivity index proposed in Suits (1977). Intuitively, this Suits index measures the concentration of aggregate tax contributions by income group. To keep it simple, Figure 1 illustrates calculation of Suits index in terms of a tax-income Lorenz curve.
Figure 1: Lorenz-type tax contribution curve and Suits index
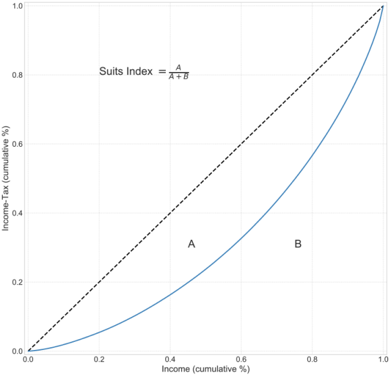
These Lorenz-type curves present tax contributions of the lowest to highest income group. A proportional tax system is a 45 degree (dashed) line as shown in Figure 1. It simply states that the share of tax contribution does not change as income rises in a proportional tax system. A progressive tax system is a convex (blue) curve below the 45 degree line of proportionality. The Lorenz-type tax contribution curve provides an aggregate measure of tax progressivity in terms of the tax contributions relative to the income distribution.
Technically, Suits Index is a concentration coefficient measuring the area between the concentration curve and the 45 degree line of proportionality, A/(A+B). It is in essence a relative concentration coefficient for tax contribution inequality. It has values between +1 and -1. Suits index is 0 under a proportional tax system. A negative value indicates a regressive tax system; meanwhile, a positive value indicates a progressive tax system. The tax system is most regressive when Suits index is -1, where the entire tax burden is allocated to members of the lowest income percentile. Conversely, the tax system is most progressive when Suits index has a value of +1, where the entire tax burden is allocated to members of the highest income percentile. Closer to +1 on the Suits index, the more progressive is the income tax system.
Data
We use two data sets to compute Suits index for the Australian personal income tax system: Confidentialised unit records of individual income tax returns provided by Australian Tax Office (ATO tax return) and Household, Income and Labour Dynamics in Australia Survey (HILDA). Note that, since income tax payments are not available in ATO tax data we impute these values using the corresponding income tax codes. In addition, we restrict our analysis the samples of positive income and non-negative tax payment. For comparison, we use unconfidentialised unit record data from HILDA.
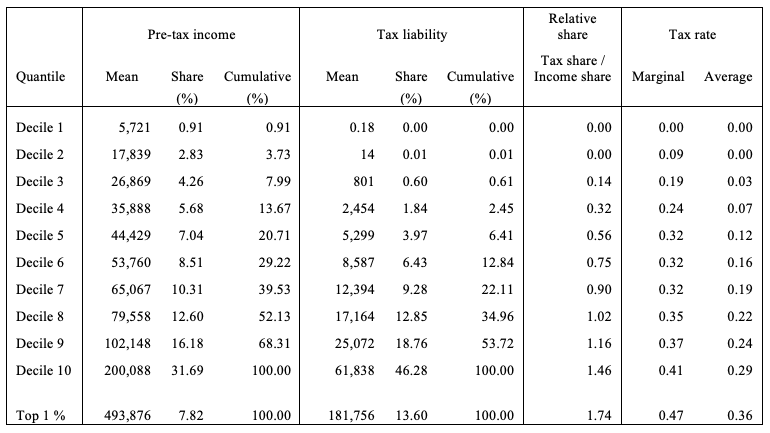
Table 1 provides some stylized facts on the distribution of income and tax liabilities in 2016 using ATO data.
Table 1: Distribution of Income and tax liabilities in 2016 from ATO data
The main results
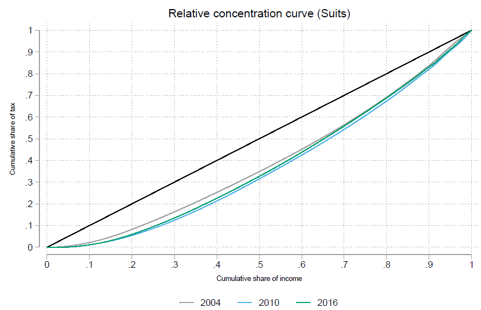
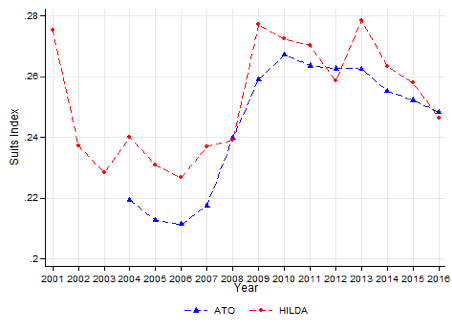
We report the levels of tax progressivity between 2001 and 2016 in Figure 2. Figure 2(a) displays the Lozenz-type tax contribution curves, using ATO data. Figure 2(b) reports the estimates of Suits index from 2004 to 2014, using both ATO and HILDA data sets.
Figure 2: Tax progressivity in Australia
(a)
(b)
Our main findings are summarized as follows.
First, the Australian income tax system is indeed progressive as the Suits index is positive. There is an increase the level of tax progressivity from 2004 to 2016.
Second, there is an indication of a tax progressivity cycle in the ATO data. The Suits index shows a sharp decline from 2001 to 2006. This is followed by a rise in progressivity peaking between 2009 and 2010 and again declining afterwards. The cyclical trend is mainly driven by the effects of the tax reforms and shifts in income distribution.
Third, the estimate for the Suits index, using HILDA data from 2001, reveals a similar trend of tax progressivity. However, there are differences in value, which are mainly due to differences in data. HILDA data includes individuals who do not file a tax return. In addition, HILDA only includes estimated deductions, while ATO data includes actual amounts.
Our findings complement a few other previous studies that highlight the trend in tax progressivity over the last century in Australia. Smith (2001) finds a peak in tax progressivity in the early 1950s and a strong decline till the late 1970s followed by a relatively steady trend till 1997. Herault and Azpitarte (2015) examine progressivity from 1994 – 2009 and finds that income tax progressivity tended to decline from 1997 to 2005, and increased in 2007 and 2009. Our estimates are consistent with their findings. Importantly, we find that the income tax system has become less progressive since 2010.
The role of income growth and bracket creep
The interplay between bracket creep and tax policy plays a significant role in the cyclical trend in progressivity. Income growth pushes more individuals into higher tax brackets. This phenomenon is known as “fiscal drag” or “bracket creep”.
Our analysis shows that in Australia’s case between 2004 and 2016, bracket creep tended to lower progressivity. However, even in the absence of any automatic indexation of income brackets to nominal income growth this was countered by regular changes to tax brackets, marginal tax rates and various offsets that reduce tax burdens on lower income quantiles.
To examine the impacts of bracket creep on progressivity, we conduct a counterfactual analysis on ATO data between 2004 and 2016 where we hold a given tax schedule constant and examine the effect of changes in the income distribution on progressivity. We do this by applying the tax schedule for each year on the respective year and the years that follow. For instance, we apply the 2004 schedule to all years, the 2005 schedule from 2005 to 2016 and so on till 2015. This allows us to isolate the impact of the changes in the income distribution on tax progressivity for the subsequent years.
Figure 3: Constant tax schedules lead to declining progressivity with income growth
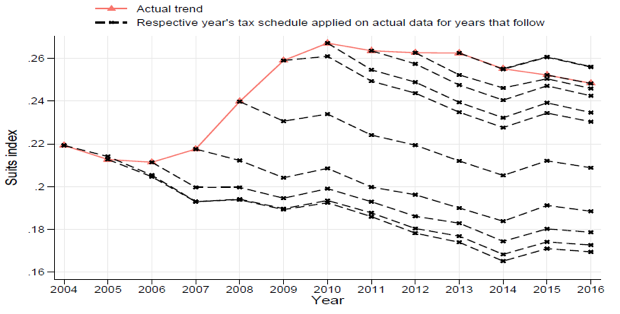 As evident from the dashed lines showing counterfactual trends in Figure 3, when the tax schedule is constant, income growth results in a declining progressivity. This is a result of a larger proportion of individuals being pushed in to higher income brackets as their nominal income grows. For greater insight, consider the extreme case where 2004 are left unchanged since 2016.
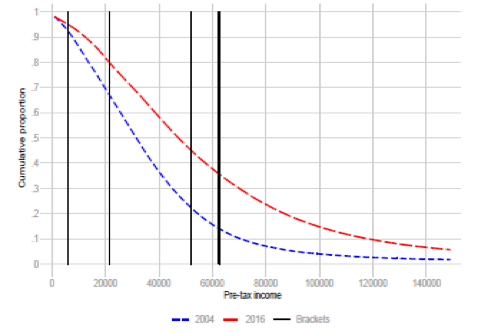
Figure 4 shows the reverse cumulative distribution functions for 2004 and 2016. The vertical lines give the 2004 income tax brackets. Compared to 2004, a larger portion of taxpayers in 2016 are above the tax-free threshold. Overall, a larger proportion of individuals are in the higher tax brackets compared to 2004.
Figure 4: Reverse cumulative distribution 2004 and 2016 and income brackets 2004
Juxtaposing the counterfactual trends in Figure 3 with the actual trends reveals the role of tax policy in mitigating declining progressivity due to bracket creep. For instance, our decomposition exercise shows that the significant increase in progressivity from 2006 to 2009 was largely due to reductions in the tax burden of the lowest income earners through changes to the LITO. From 2006 to 2009, the government significantly increased the LITO thresholds. There was also a steep increase in the maximum offset from $235 in 2006 to $1,500 in 2012.
What this means for policy
In the current policy debate, it is important to have a comprehensive understanding of trends in tax progressivity over time. Our analysis provides new evidence, which complements a few other previous studies on tax progressivity in Australia. Smith (2001) finds a peak in tax progressivity in the early 1950s and a strong decline till the late 1970s followed by a relatively steady trend till 1997. Herault and Azpitarte (2015) finds that income tax progressivity tended to decline from 1997 to 2005, and increased in 2007 and 2009. Our work indicates a tax progressivity cycle since 2001 with a decline in progressivity level since 2010. Indeed, our research provides quantitative substance to debates on the fairness and effectiveness of Australia’s tax system and tax policy reforms.
Further reading
Chung Tran and Nabeeh Zakariyya. 2019. “Tax Progressivity in Australia: Facts, Measurements and Estimates”, RSE Working Paper.
Other articles in the Budget Forum 2019
The Instant Asset Write-off Will Lift Investment—but Is That What We Want?, by Steven Hamilton
Refundable Franking Credits: Why Reform Is Needed (and Why It Should Be Targeted) – Part 1, by John Taylor and Ann Kayis-Kumar
Refundable Franking Credits: Why Reform Is Needed (and Why It Should Be Targeted) – Part 2, by John Taylor and Ann Kayis-Kumar
“All Without Increasing Taxes”? A Closer Look at Treasurer Frydenberg’s Refrain Repeated Eight Times in His Budget Speech, by John Taylor and Ann Kayis-Kumar
Tax Offsets and Equity in the Scheme for Taxing Resident Individuals, by Sonali Walpola and Yuan Ping
Forecasts and Deviations – the Challenge of Accountable Budget Forecasting, by Teck Chi Wong
Targeted Tax Relief Makes the Tax System Fairer but the Economy Poorer, by Steven Hamilton
A Simpler Tax System Should Spark Joy—Eliminating Tax Brackets Sadly Doesn’t, by Steven Hamilton
A Budget That Supports Indigenous Australians?, by Nicholas Biddle
Women in Economics 2019 Federal Budget Reflections, by Danielle Wood
Coalition and Labor Voters Share Policy Priorities When They Are Informed About Inequality, by Chris Hoy
Future Budgets Are Going to Have to Spend More on Welfare, Which Is Fine. It’s Spending on Us, by Peter Whiteford


Recent Comments