

The Australian Superannuation Guarantee requires employers to pay 9.5 per cent, into an employee’s superannuation account. The legislation has been subject to considerable policy change since it was first introduced in 1992.
In a recent paper (Guest, 2018), I ran some simulations of the effects of the Superannuation Guarantee Levy (SGL) for three representative workers with different lifetime income profiles: low income, medium income and high income. I compared the financial assets accumulated over a working life from age 20 to 65 under the SGL with equivalent alternative saving that generates the same rate of return before tax. My simulations showed that all three representative workers—low, middle and high income earners were better off under the SGL. However, the percentage gains in lifetime financial assets were considerably higher for the low and high income earners, compared with the middle earners.
Simulation method and assumptions
My baseline simulation relies on some key assumptions about the operation of the superannuation and income tax system:
- SGL is 9.5 per cent until 30 June 2012 and increases by 0.5 per cent each year until it reaches 12 per cent from 1 July 2025;
- SGL contributions are taxable up to a cap of $25,000 per year, at a flat 15 per cent or 30 per cent for those earning an adjusted taxable income of more than $250,000. Contributions beyond $25,000 per year are taxed at marginal tax rates;
- Under the Low Income Superannuation Tax Offset (LISTO), if taxable income is less than $37,001, the tax paid on contributions up to $500 is added back to the super account;
- Supererannuation fund earnings are taxed at 15 per cent (no consideration of imputation credits or capital gains which produce a lower effective tax rate);
- Income tax schedules for 2017-18 are applied (including the Medicare levy);
In my simulation, I assume a 5 per cent pre-tax rate of return on superannuation assets, which I assume to be equal to the pre-tax return on non-superannuation financial assets.
Each of the three representative workers (low, medium and high income) enters the workforce today aged 20 and their employer contributes the SGL from age 20 until retirement at age 65. The age-earnings data by income level is chosen to approximately match the age-earnings distribution of cash earnings of all employees at May 2016 (ABS). The low-income profile is set at approximately the 20th percentile of the age-earnings distribution, the medium-income profile is at the 50th percentile, and the high-income profile at the 80th percentile.
The whole of working life approach I take in the simulation is important because workers are affected by different elements of the super regime at different points in their working lives. Medium earners for example are in fact low earners while young, and eligible for the contributions tax offset for some initial years. They then move into higher tax brackets, which brings a sensitivity to some of the proposed taxation changes.
Two cases are compared for each worker income profile (low, medium and high). The first case is the application of SGL of 9.5 per cent with legislated increases to 12 per cent. Workers benefiting from the SGL are assumed to make no additional saving—they simply consume what is left over from wage income after income tax and superannuation deductions including tax. This implies that consumption is a residual in the simulations, after saving has been determined. Consumption over time is not discounted, except in the final set of simulations for low income earners (discussed below).
The second case is zero SGL accompanied by equivalent saving outside the superannuation system. The zero SGL case assumes that workers, at every age, choose to save an amount equivalent to the legislated SGL. It is assume that the saving is in alternative financial assets with the same 5 per cent rate of return as superannuation.
Simulation scenarios: Different reform options
Five cases were simulated, which represent some reform options for superannuation that have been proposed by stakeholders over the years:
Case (i) Baseline, current superannuation and tax parameters, as described above;
Case (ii) 15 per cent tax rate on superannuation contributions is replaced by a tax at the worker’s marginal tax rate (MTR) less a 15 per cent offset;
Case (iii) Case (ii) but without the 15 per cent offset, that is, the full marginal tax rate applies to contributions, and a zero tax rate on superannuation fund income;
Case (iv) Case (ii) plus a cut in the tax rate on superannuation fund income from 15 to 7.5 per cent;
Case (v) Increase the tax rate on superannuation contributions from 15 to 30 per cent.
The results: disadvantage to medium income earners
The gain in financial assets at retirement under the SGL as compared to the alternative saving case, under the low, medium and high representative income profiles, is shown in Table 1. The gain is expressed as a percentage of the amount under the alternative saving case, and also as a total amount of assets in thousand dollar units.
Under case (i) baseline, all three income earners have higher financial assets under the SGL, ranging from 15.8 per cent (medium earner) to 23.9 per cent (low earner) to 24.5 per cent (high earner). All income earners are better off under the SGL because the contributions tax is on pre-tax income at 15 per cent and the income in the fund is taxed at 15 per cent, which provides a benefit as long as the worker’s marginal tax rate is sufficiently greater than the 15 per cent. High earners gain most from these low flat tax rates and low earners benefit from the LISTO for most of their working lives. However, medium earners receive the LISTO only up to the age of 25 at which time their income rises above the $37,000 threshold and benefit less from the reduction in tax rates than high earners.
Table 1. Comparing the SGL and alternative saving
Gain (+)/loss(-) in retirement assets from SGL for given age-specific consumption
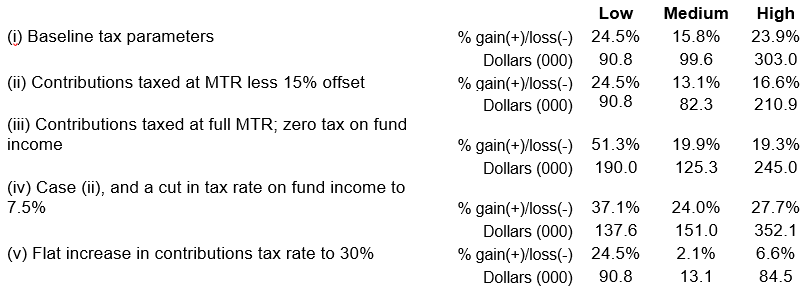
The results in Table 1 show that middle income earners gain least in percentage terms from the SGL in all of the five cases considered. Specifically, for the other cases, the simulation finds:
- Case (ii): Low earners gain the most in retirement assets, and again medium earners gain the least.
- Case (iii): Low earners gain twice as much from the SGL as they do in the baseline case. They lose nothing from the heavier tax on contributions since they continue to receive a full offset for contributions tax, while they gain from paying no tax on fund income.
- Case (iv): The relevant comparison here is with Case (ii). A lower tax rate on fund income makes all earners better off in terms of retirement assets.
- Case (v): The 30 per cent contributions tax rate almost wipes out the gains for the medium earners from the SGL.
Qualifications
A couple of qualifications and nuances are worth mentioning. First, the gains under the SGL are very sensitive to assumptions about the relative rate of return under alternative forms of saving.
Second, the gains in financial assets from the SGL occur in the last 15 years of working life for all earners. In fact, the medium and high earners are slightly worse off for the years from age 20 to 50. This is because the loss from the contributions tax is not compensated by the concessional tax rate on superannuation earnings until the earnings become sufficiently high, which requires an accumulation of superannuation assets from age 20 to 50.
Third, the gains for low earners should be weighed against the particularly high sacrifice of consumption for low earners, and the possibility that they may earn higher returns from alternative forms of saving, in particular, from owner-occupied housing.
This blog post is based on Guest, R. (2018), ‘Does compulsory superannuation disadvantage middle income earners?’, Economic Analysis and Policy, 59, 130-137.


Recent Comments