

Concessions for people living in rural and remote areas have been a key feature of the Australian tax system since 1945. The Zone Tax Offset (ZTO) was introduced in that year as “compensation for the disabilities of uncongenial climatic conditions, isolation, or relatively high living costs.” The ZTO divides Australia into three tax ‘zones.’ Zone A (very remote) receives the largest concession, Zone B receives a smaller concession and the rest of Australia receives no concession. Since 1982, there are also ‘special zones’ within Zones A and B that attract additional benefits.
The concessions were initially tax deductions but were converted to tax offsets (which are fixed reductions in tax liability) in 1976. The boundaries for Zone A and Zone B have remained largely unchanged since 1945, although the value of the ZTO has changed over time. Today, its base value for people living in Zone B is only $57. In contrast, in 1946, it was worth the equivalent of approximately 2 per cent of wages for average wage earners.
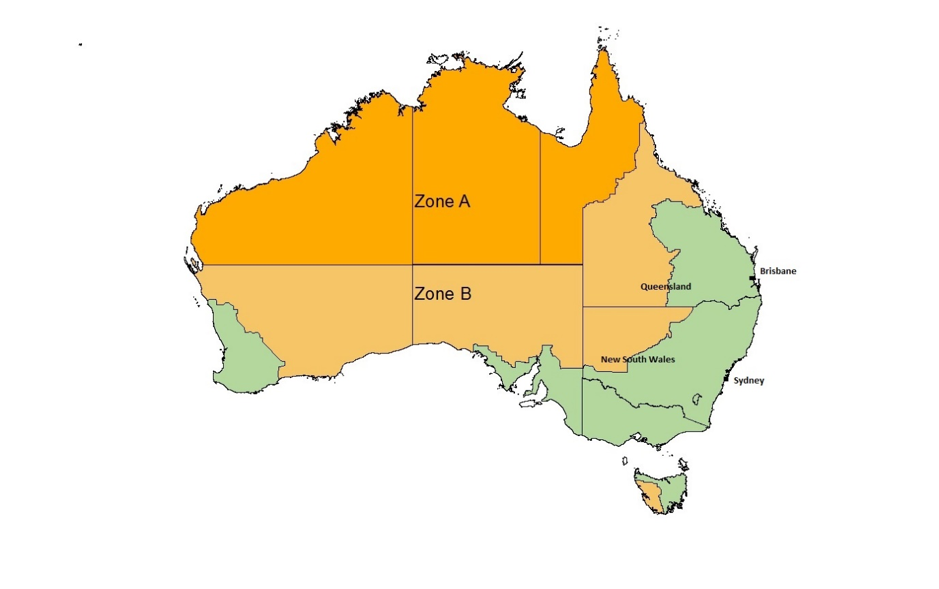
Figure 1: ZTO Boundaries
In a recent paper, we ask whether the ZTO affected population growth in targeted regions. This question is not straightforward to answer because it is difficult to construct a credible counterfactual for what would have happened to population growth in affected areas had the ZTO not been introduced. We deal with this problem by focussing our attention on towns close to the Zone B boundary in New South Wales (NSW) and Queensland (QLD), where we observe a reasonably large number of towns situated on either side of the border. Our estimation strategy treats towns located outside of Zone B but close to the ZTO border as controls for nearby towns that are just inside Zone B and have therefore received the offset.
We use data from the historical censuses and study the period 1945-1966, which coincides with when the ZTO was most generous. The primary goal of estimating the effect of the ZTO in the past is to inform how changes to it might affect outcomes today. It is also an interesting historical investigation into the potential role that tax policy has played in regional development in Australia.
Higher population growth, but the effect was temporary
Our results indicate that the ZTO caused population growth to be 5-8 percentage points higher per year between 1945-1947. This does not seem to be due to people living close to the border relocating to the other side. Rather, the effect on growth was temporary. We find no strong evidence that growth was higher in towns eligible for the ZTO after 1947.
It is worth noting that the period around the end of World War II saw populations declining in rural NSW and QLD. In fact, between 1933-1947, the population declined by 10% on average in towns in our ‘control’ group. So, our conclusion may be in fact that the ZTO slowed down population decline in the areas we study, rather than lifting growth per se. It is possible that the ZTO may have been less effective had the policy been introduced in a different period. Indeed, the period where we find no effect (1947-1966) was a period when the population was growing.
There are other potential reasons why the effects we find are only temporary. In particular, economic theory predicts that regional income subsidies can never support sustained population growth. As new people move into an area, the cost of goods that cannot be traded outside the area (like housing) rises, in turn making the area less desirable to live in. This is one reason why economists are often sceptical of policies like the ZTO – if the theoretical predictions are right, then the benefits eventually fall to landowners, who may not be the intended target. Unfortunately, we were not able to estimate the effect of the ZTO on house prices with our data.
It is also important to note that our results can only speak to the effect of the policy on the population dynamics in Zone B. The Zone A concession has always been significantly larger than the Zone B concession. In 1945 it was twice as large – today the base rate is almost six times higher at $338. Intuitively, since the Zone B concession is smaller, one may surmise that our results are a lower bound for what would have happened to Zone A. However, it is not clear that people would have been as responsive to the financial incentive in Zone A, since much of Zone A is extremely isolated.
Second-order effects matter
Our results are timely given that the Productivity Commission is currently conducting a review into the ZTO and related regional income concessions. The efficacy of the ZTO as a form of welfare support rests on its ability to target those in need. Much of the current debate around the targeting of the ZTO is focused on the location of the tax zones and the generosity of the concession. These are important issues for the Productivity Commission to consider in its review.
Equally important are the second-order effects that occur because people’s incentives to locate in a particular region are distorted. While politicians and other concerned parties have listed population growth as a desirable outcome of the ZTO, if this is associated with higher living costs, then the welfare benefits may not be distributed as intended. Alternatively, it is possible that population growth could result in welfare benefits even greater than the value of the concession itself. This could occur, for example, if new entrants to the community create new business opportunities that raise the average level of productivity. Such benefits could come at the expense of the regions people are moving from. Quantifying such effects would be valuable to any broad evaluation of the ZTO and its associated concessions.


Pingback: The Poor Pay More: Why the Remote Area Allowance Needs Urgent Reform - Austaxpolicy: The Tax and Transfer Policy Blog