

Following the abandonment of a string of controversial copayment policy proposals (i.e., the ‘$7 copayment’ and its equally ill-fated successors), medical stakeholders have maintained strong and vocal opposition to the government’s recently extended Medicare rebate indexation freeze.
In total, Medicare rebates will be frozen for six years, meaning that bulk-billing doctors will receive the same reimbursement for servicing a patient in 2020 as they did in 2014, despite the rising cost of running a practice. For privately billed patients, it means the real value of their rebate will fall over time. Medical organisations, including the AMA and RACGP, suggest that the freeze is simply a copayment policy “by stealth.” They warn that it will undermine Australia’s bulk-billing system, bringing harm to both doctors and patients by forcing many more GPs to either start charging their patients out-of-pocket fees or otherwise absorb a large revenue cut over time.
Bulk-billing is common in Australia. In 2015-16, the average bulk-billing rate for non-referred GP services was at a record 85.1% (though this varies considerably by state). Two-thirds of patients were bulk-billed for 100% of their GP services; 89% were bulk-billed for at least one of their GP visits during the year, and 81% of patients were bulk-billed for 50% or more of their visits. This means that the majority of Australians who visited their GP in the past year paid no out-of-pocket fees for the majority of their visits. Patients who were not bulk-billed by their GP paid an average out-of-pocket fee of around $34 in 2015-16.
We don’t know how doctors, particularly those who bulk-bill all or most of their patients, will adjust their billing practices over time to cope with income losses generated by the rebate freeze. For individual practices, this will depend on factors such as location, competition, and patient mix; for example, practices that face stiff competition or those that service highly disadvantaged populations may be more reluctant to reduce the availability of bulk-billed services.
Nevertheless, we are interested in how the widespread imposition of GP fees might impact patients with different health and income characteristics. We have explored these questions using some simple modelling with data from the nationally representative Household Income and Labour Dynamics in Australia (HILDA) survey.
Poorer vs. wealthier Australians have different health characteristics. Within almost every age group, people on the lower end of the income distribution tend to have considerably worse health (as measured by the presence of one or more chronic illness). This so-called ‘socioeconomic health gradient’ is mirrored by demand for GP visits. This means that within each age group, lower-income individuals are not only sicker but also have a higher need for GP services (see Figure 1).
Figure 1: Chronic illness and number of GP visits by equivalised disposable household income
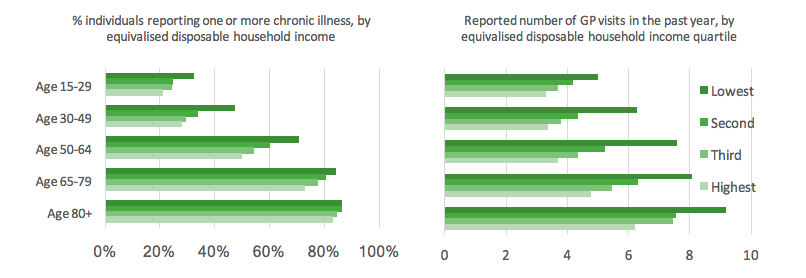
One way to understand how copayments might impact Australians across the income distribution is to calculate the proportion of their income that they would need to absorb to maintain the same number of GP visits following the introduction of a copayment. We use equivalised disposable household income adjusted for composition and economies of scale as our income measure.
We make a few important assumptions. We assume that all of the GP consultations reported by our sample were bulk-billed, standard length consultations. We also make the simplifying assumption that all GPs will charge the same average copayment, though this is of course highly unlikely – some previously bulk-billing GPs may start charging much higher fees than others, and some will maintain bulk-billing arrangements for many or all of their patients.
Our goal is to understand the distributional consequences inherent in widespread GP copayments, albeit in the face of considerable uncertainty.
We consider a range of hypothetical copayment ‘scenarios’:
1. The Abbott government’s original $7 copayment (all patients pay $7 per GP visit, with concessional patients exempted beyond ten visits in a year).
2. The copayment scheme recommended by the National Commission of Audit in their 2014 report: non-concessional patients pay a $15 copayment per GP visit and concessional patients pay $5, with a ‘safety net arrangement’ such that the copayment is reduced by 50% after the first 15 visits in a year.
3. A copayment scenario where non-concessional patients are charged a $25 fee per visit whilst bulk-billing is maintained for concessional patients. A non-concessional fee of $25 is on the lower end of what polling suggests doctors are likely to charge in response to the freeze.
4. A copayment scenario where non-concessional patients pay a fee of $40 whilst concessional patients pay a $10 fee. A $40 fee is approximately the difference between the AMA’s current recommended standard fee of $78, less the frozen rebate amount of $37.05. The AMA does not make specific recommendations about concessional fees; for illustrative purposes we set it here at 25% of the non-concessional rate.
In Figure 2 below we plot the average estimated cost burden of each of these copayment scenarios, by chronic illness status and equivalised disposable household income quartile.
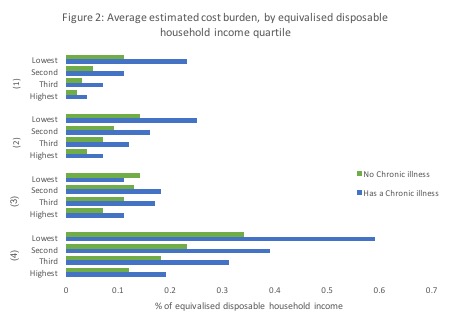
In every scenario where concessional patients are required to pay a copayment (scenarios 1, 2, and 4) – even one that is a third or a quarter of the non-concessional rate – we see severely regressive outcomes. In each of these scenarios it is clear that patients in the lower income brackets would need to absorb considerably more relative to their income than their wealthier counterparts, particularly if they are living with a chronic illness. In scenario 2, for example, the average person with a chronic illness in the lowest income quartile would need to absorb between three and four times the cost burden of their counterpart in the highest income quartile.
These patterns suggest that widespread imposition of copayments could likely hit sicker, lower income patients the hardest due to their higher demand for health services and relatively lower capacity to absorb the additional cost.
These regressive patterns hold equally when we look at households rather than individuals, suggesting that children from low-income families could be impacted in some cases if families start feeling the need to cut back on primary healthcare services because of the high aggregate costs.
In (3), where we have estimated the distributional outcomes of a scenario exempting concessional patients from a copayment altogether, we do see a somewhat less regressive pattern. This suggests the importance of maintaining access to free GP care for vulnerable low-income populations, including people living in rural areas, the elderly and chronically ill. However, GPs who service a high proportion of disadvantaged patients may struggle considerably to maintain such a billing system, leading to concerns that the greatest reductions in access to bulk-billed consultations may be experienced by those patients with the highest need.
We are yet to see the dramatic declines in bulk-billing rates anticipated by medical organisations as a result of the rebate freeze. However, there are three and a half years left of the freeze and as the cost to GP practices rises over time, we may well begin to see its impacts. Perhaps the greatest concern is that if patients delay or avoid visiting a GP because of the cost, we may end up with bigger, more expensive problems down the line in our hospitals.


Recent Comments