

Many developing countries face the twin challenges of lower revenues from traditional tax sources and growing fiscal demands. In response, they embarked on fiscal reforms, increasing the share of new revenue sources – higher personal and corporate income taxes, sales taxes, value added taxes, and other taxes. These fiscal reforms are necessary and welcome but require large investments in improving tax administration and collection. But such investments are often challenging and difficult in countries that are characterized by high enforcement costs due to large informal sectors and other structural factors.
Against this background, in Aizenman, Jinjarak, Kim, and Park (2015) we take stock of the recent patterns of tax revenue mobilization in Asia, Latin America and other regions, subject to data availability. Asia and Latin America are at broadly similar income and development levels, so a comparison of the two regions is significant and interesting. While the tax ratios in Asia (14%) and Latin America (17%) were significantly lower than in Europe (20%) in the 2000s, tax revenues rose substantially in both Asia and Latin America during that time.
According to the public finance literature, understanding a tax system requires an understanding of their interaction with the quality of institutions and economic structure of a country.
To illustrate, if a large share of the GDP is produced by a few commodity exporters, for example oil firms in oil dependent economies, tax collection can be centralized. For a given quality of institutions, tax collection is more challenging in countries with a large informal sector and an agricultural sector dominated by small farms. Relative to Asia, Latin America has more experience in using fiscal policy to promote equity. In some countries, cash transfer programs such as Brazil’s Bolsa Familia or Mexico’s Opportunidades and Progresa have helped to mitigate inequality.In contrast, in the advanced economies, redistribution of income via progressive taxation and pro-poor public spending has long been one of the main objectives of fiscal policy.[i]
We can expect the developing countries to follow in the footsteps of the developed countries as they grow richer and their citizens’ demand for public services grow. This is especially true for largely middle-income Asia and Latin America. Their embrace of globalization – i.e. trade and financial integration – will reduce the relative importance of trade tax, inflation tax, and financial repression, and increase that of income taxes, VAT, and sales tax. Extensive structural change in the developing world will impinge on tax revenue mobilization.[ii]
Pattern of Tax Revenue Trends in Asia, Latin America, and Other Regions
The tax to GDP ratio is 20%% or below for the majority of countries in Asia and Latin America. Income tax/GDP is equal to or less than 10%%, below the level of OECD countries. Trade tax/GDP is below 3 % for most countries. Social contribution/GDP is clearly higher in OECD countries than elsewhere. A number of Latin American countries depend on grants and other non-standard sources of government revenue.
Figure 1: Composition of Revenue Collection (% of GDP), Asia v. Latin America, 2012.
Tax revenues include income, goods, property, and trade taxes. Income taxes include taxes on income, profits, capital gains, on individual and corporations. Goods taxes include general taxes on goods and services, and excises. Trade taxes include taxes on international trade and transactions. Social contributions include social security contributions and other social contributions. Grants include revenues from foreign governments and international organizations.
Asia (average total tax and other revenue collection = 38.9% of GDP)
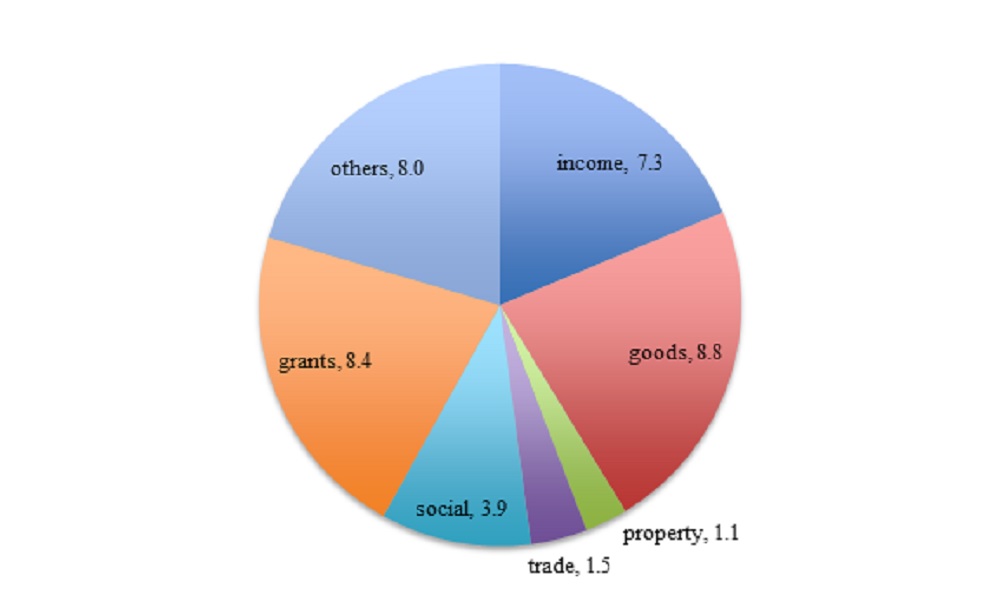
Source: Government Finance Statistics.
Latin America (average total tax and other revenue collection = 29.0% of GDP)
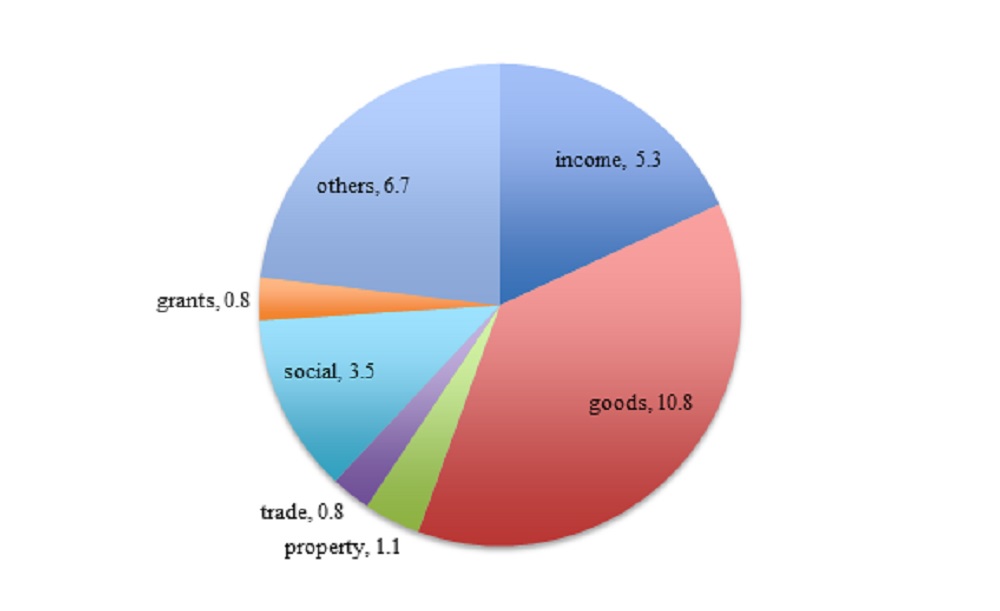
Source: Government Finance Statistics.
Figure 2: 5-Year Average Tax/GDP
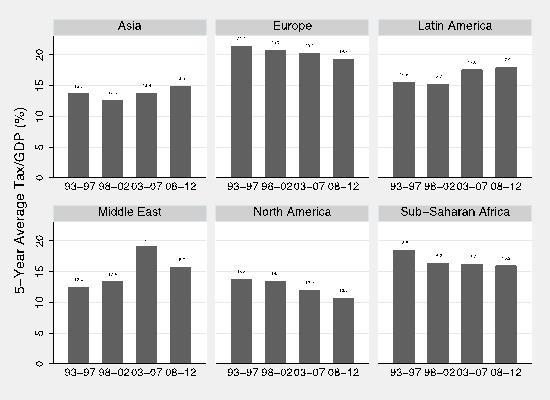
Figure 2 shows that the average tax/GDP in Europe over the period from 1993 to 2012 is 20 %, higher than the rest of the world. For Asia and Latin America, the tax to GDP ratio is trending higher, and averaging to 14.8 % and 17.9 %, respectively, during the past five years.
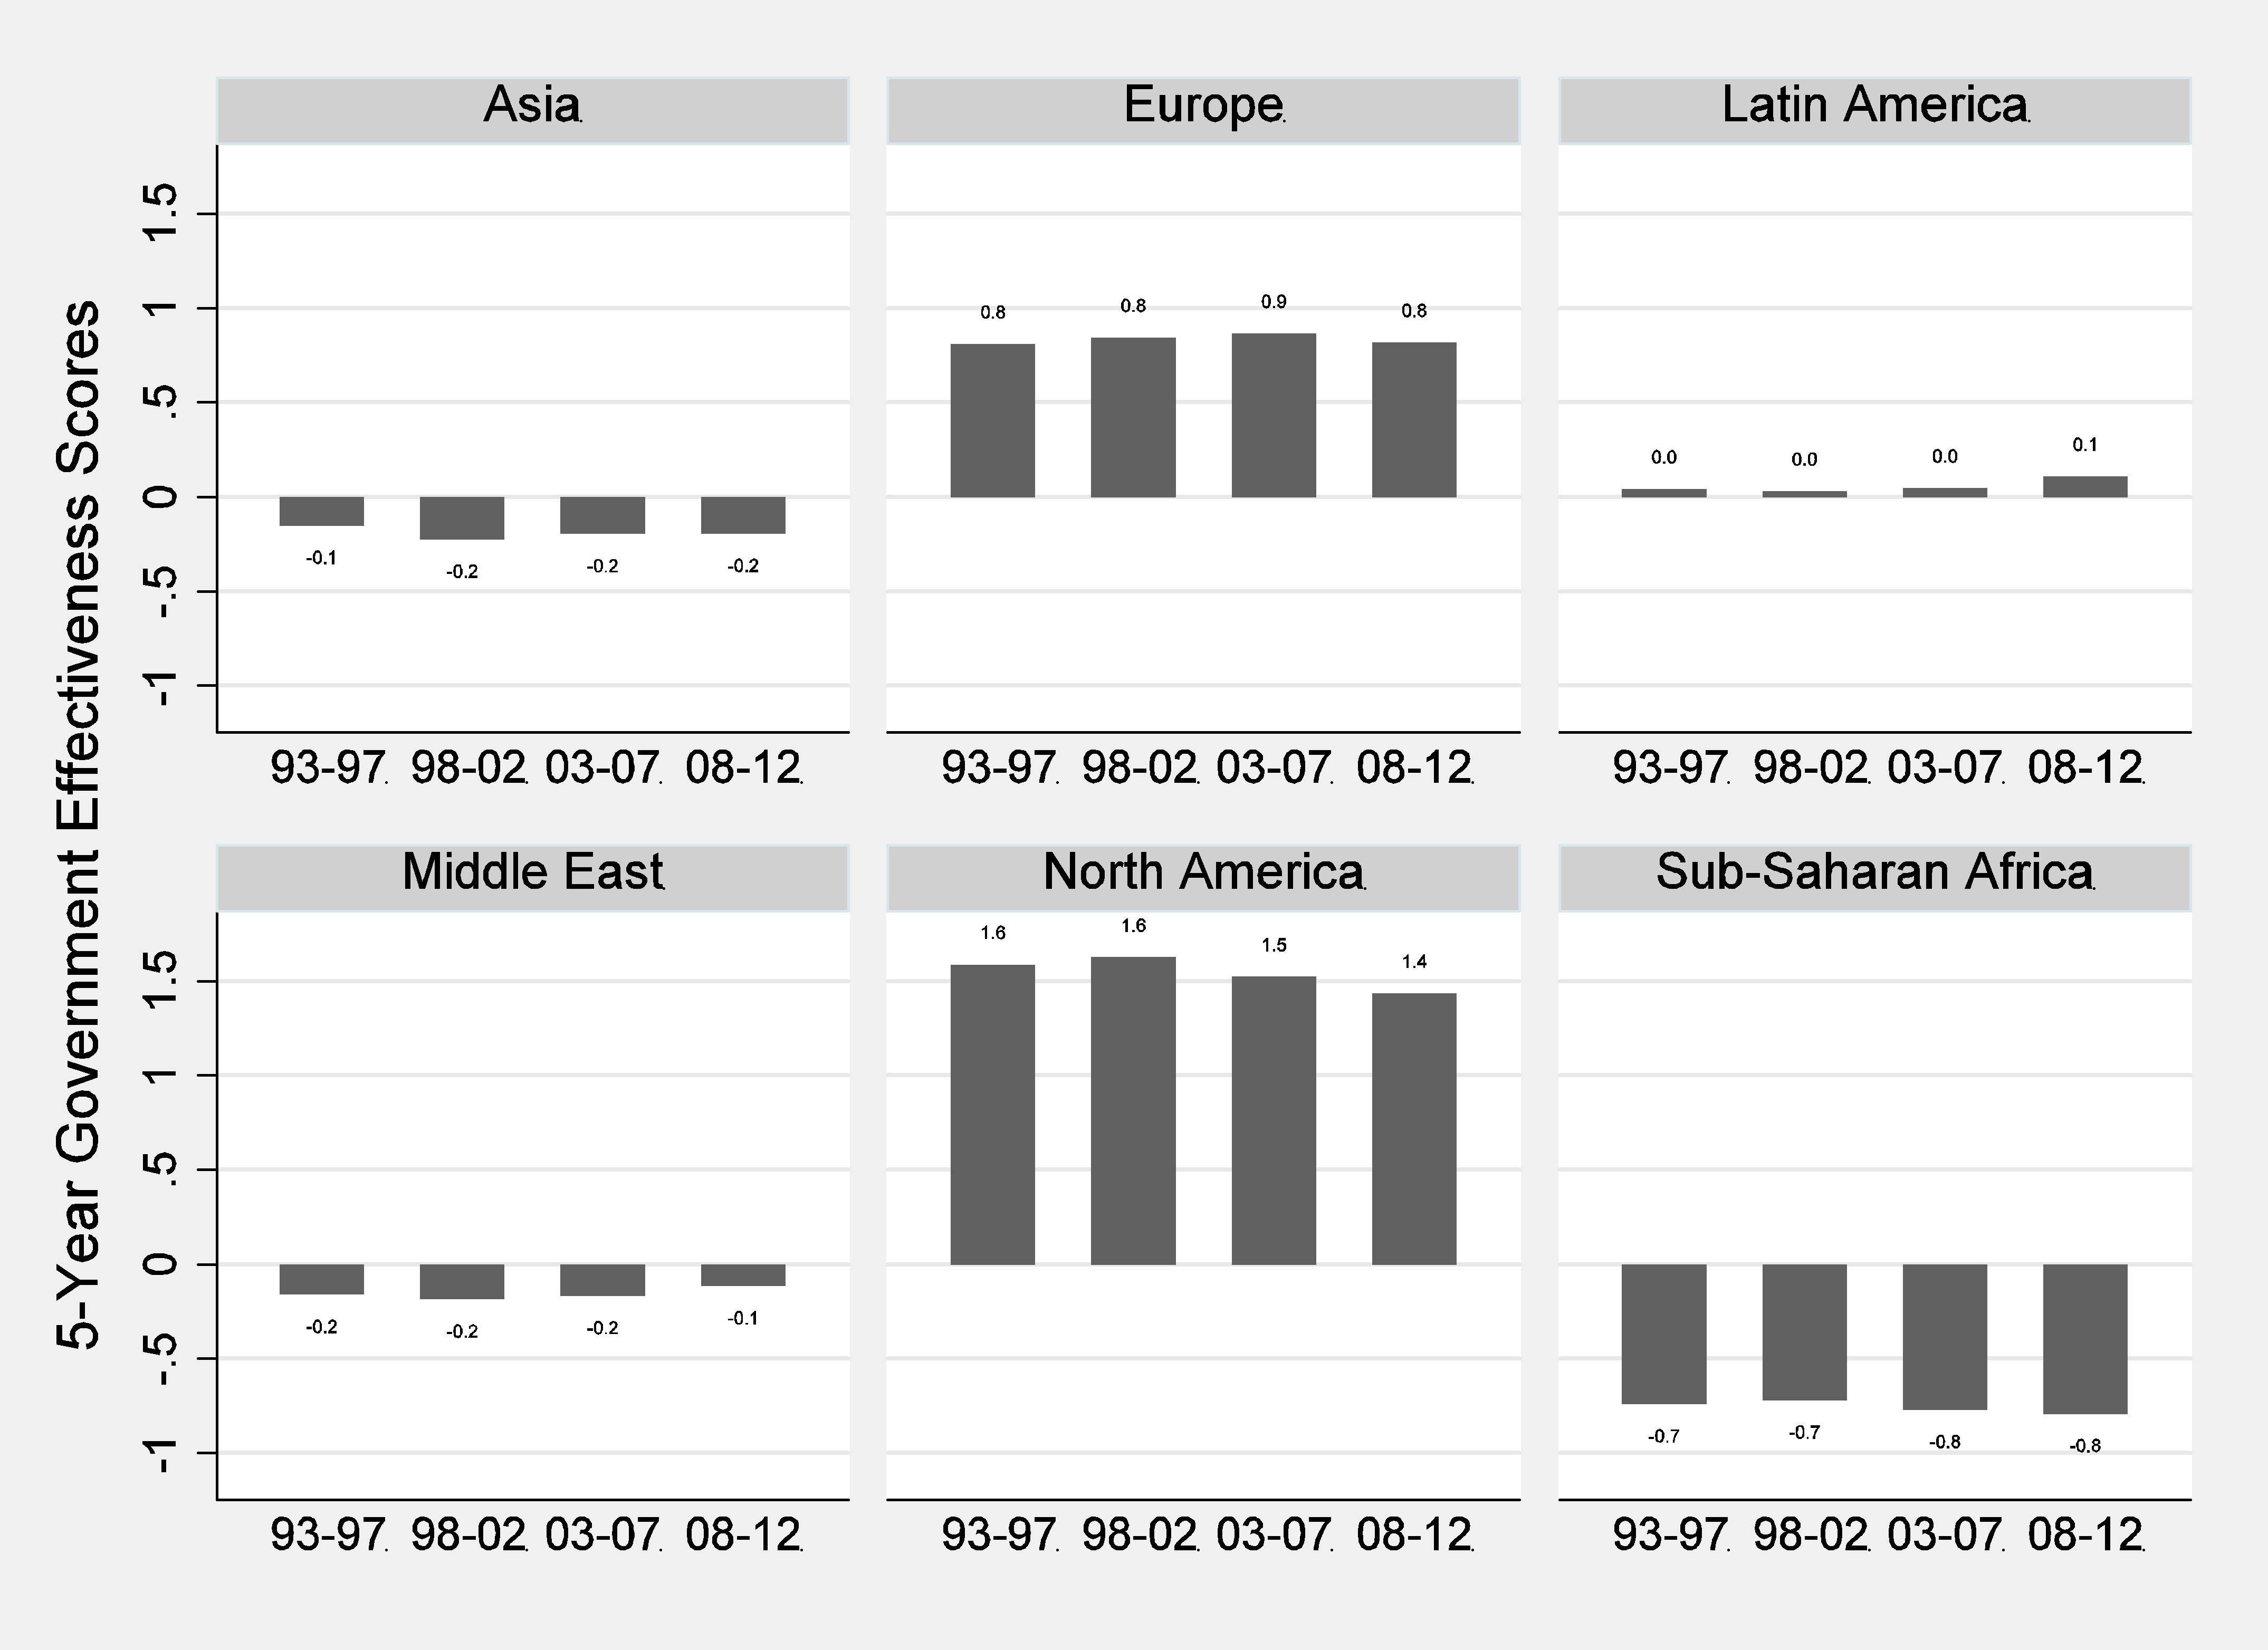
Figure 3: Summary Index of Government Effectiveness
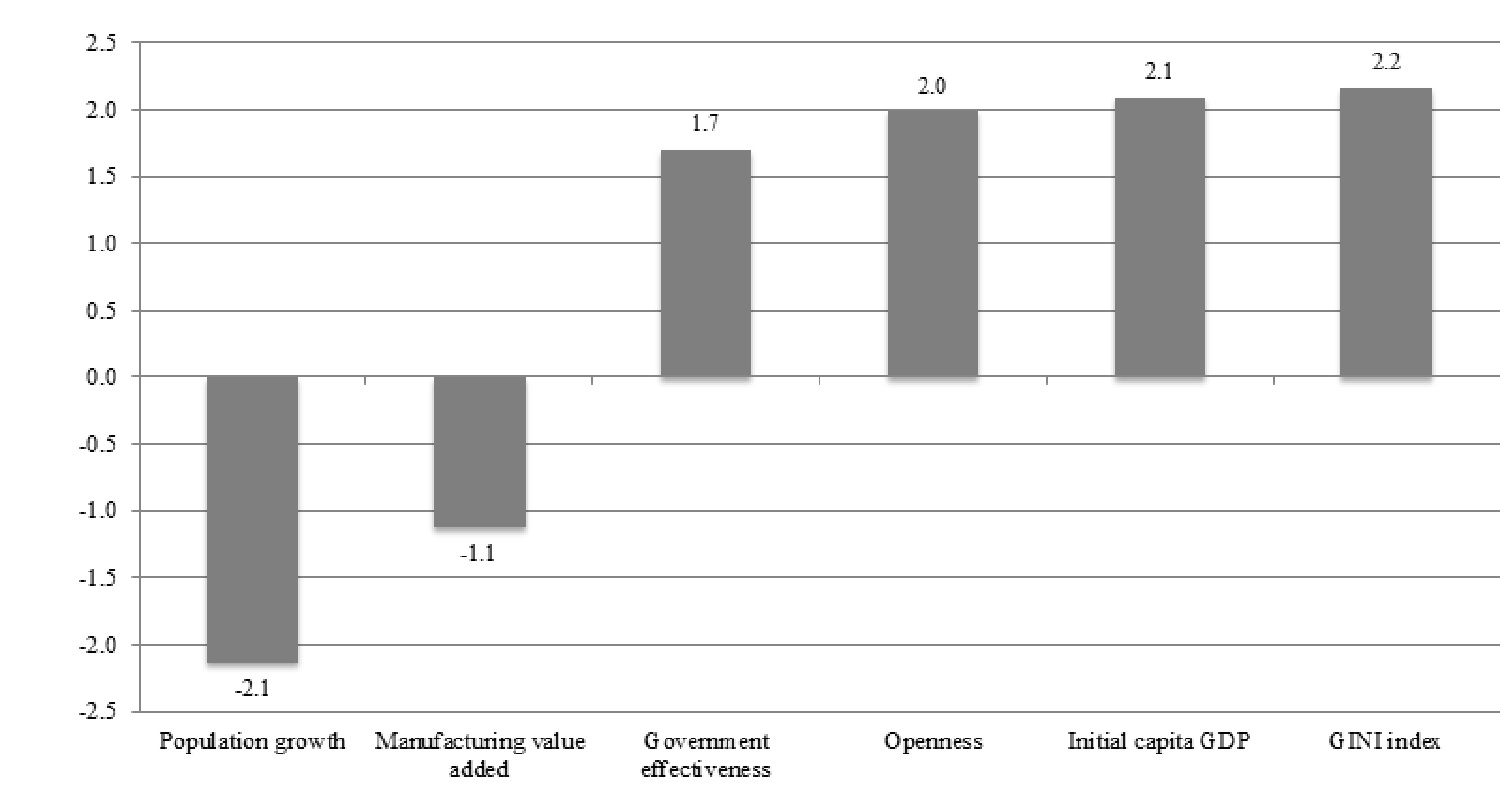
Figure 3 shows a summary index of government effectiveness, where a higher number indicates stronger government effectiveness. Government is most effective in North America, followed by Europe. On the other hand, Latin America, Asia, Middle East, and Sub-Saharan Africa have relatively much weaker institutional quality throughout the past two decades. Over the past decade, tax preparation time declined in all regions. Yet, institutional quality varies significantly across the regions, and the differences persist over time.
Determinants of Tax/GDP: Empirical Analysis
Our regressions aim at explaining the tax/GDP ratio with economic and demographic variables, along with institutional quality or government effectiveness. We find that initial per capita GDP, openness of the economy, GINI index of inequality, and government effectiveness are all positively associated with the level of Tax/GDP, while manufacturing value added and population growth are negatively related. With North America as a base region and controlling for other variables, we find evidence of regional effects. Our results suggest that there is no significant relationship between tax/GDP and a number of other variables such as higher GDP growth, larger urban population, and faster time to prepare tax.
We also find that lower population growth and higher government effectiveness are associated with higher tax/GDP in Asia. On the other hand, for Latin America, lower manufacturing value added, more openness, and lower population growth are associated with higher tax/GDP. While the sub-sample regressions are able to explain more than half the variation for Latin America and almost one third for Asia, they indicate that there is no one-size-fits-all econometric specification for explaining tax/GDP collection across Asia and Latin America.
Figure 3 shows the economic significance of the coefficient estimates. The figure reports economic significance of the variables that explain tax/GDP (%). Each bar in the figure is a product of the coefficient estimate and the corresponding variable’s sample standard deviation. Openness, initial GDP per capita, GINI index of inequality, and population growth are the most economically significant variables; one standard deviation increase is associated with more than 2 % increase in tax/GDP.[iii]
To perform a robustness check on the government effectiveness and regional influences, we add controls for share of commodity exports – i.e. ores and metals, fuels, and food – and its interaction with government effectiveness, along with interaction terms for government effectiveness and regional dummy variables.[iv] The results suggest that the significant effect of government effectiveness on tax/GDP could partly reflect the government’s control of commodity export income.
Concluding Observations
In both Asia and Latin America, two largely middle-income regions of the developing world, the share of tax revenues in GDP has risen in recent years, for a number of reasons. Above all, as countries grow richer, the government tends to expand in response to the citizens’ demand for more and better public services. Further contributing to the growth of the state in the two regions are structural changes such as population aging – which induces more public spending on health care, for instance – and widening inequality – which brings about equity-promoting expenditures such as transfers to poor households. Given the heterogeneity of both Asia and Latin America, it is difficult to make sweeping comparative generalizations. Nevertheless, Latin America collects more tax revenues than Asia, and the goods and services tax plays a bigger role. Our empirical analysis of the determinants of tax revenue performance reveals both differences and similarities between the two regions. More openness and low population growth boosts revenues in both regions, but higher government effectiveness and lower manufacturing value added does so only in Asia and Latin America, respectively.
The tax revenue mobilization performance of developing countries is characterized by a great deal of heterogeneity. While progress has been made, the revenue gap between the OECD countries and developing countries suggests room for expanding revenues in developing countries, even though a large part of the gap reflects the larger size of the government in richer countries. Our study also validates the key importance of government effectiveness and the quality of institutions. Adding more disaggregated controls for various dimensions of institutional quality and economic structure, which can help explain the sizable effect of continental dummies in some of our regressions, would be a valuable future research agenda.
The VAT is especially important because it can help broaden the tax base into a more comprehensive and less distortionary structure. According to Keen (2013), in both Asia and Latin America, the average central rate of the VAT increased by about 2% from 1993 to 2012, reaching about 11% and 14%, respectively. Yet the average VAT revenue to GDP rose by 2 % GDP points in Latin America, while it fell by about 1% in Asia. This remarkable gap in de facto VAT collection can probably be explained by divergent trends in the variation of the actual VAT rates across different economic sectors and VAT enforcement. But without more disaggregated data, we are simply unable to make clear inferences from the divergent trends between these two regions. Quantifying and understanding the importance of these factors in accounting for the heterogeneous tax revenue performance across different countries and regions remains an important future research agenda.
[i] Bastagli et al. (2012) found that, on average, 25 OECD countries experienced a 15% decrease in the Gini index of inequality due to taxes and transfers in 1985-2005. Seven countries saw their Gini index fall by over 20% while five others achieved around 10% decrease through the successful implementation of fiscal measures. Similarly, Joumard et al. (2012) found that taxes and transfers reduced disposable income gaps in OECD countries. Equity-promoting fiscal programs in Asia, Latin America and elsewhere – for example, public spending on education, health care, and subsidies and transfers – require plenty of fiscal resources and hence effective tax revenue mobilization. We can expect population aging to impose significant fiscal burdens on the governments of developing countries. Older populations will increase the demand for public spending on pensions, health care, and other programs that benefit the elderly. Therefore, even in developing Asia, which has more fiscal space than Latin America and other parts of the world, fiscal space today is no guarantee of fiscal space for tomorrow.
[ii] For example, urbanization and the decline of the informal sector will widen the tax net, and the emergence of large firms in urban areas will facilitate collection. These developments put to the fore the key role of administrative capabilities and effectiveness in inducing tax compliance, which, in turn, is shaped by political economy factors
[iii] In order of their economic significance, a one standard deviation increase in the GINI index is positively associated with Tax/GDP collection by 2.2 %, initial GDP per capita 2.1 %, population growth -2.1 %, and openness 2.0 %. A standard deviation increase in government effectiveness, our variable of interest and a proxy for institutional quality, is associated with 1.7 % increase in Tax/GDP, a non-trivial relationship.
[iv]In most developing countries, the exports of commodities are controlled by a state monopoly taxing exports, such as an export board, or by a large foreign multinational that is taxed by the state. This may explain some of the big values of the regional dummies in Africa and Latin America.


Recent Comments