

Why do we care about high EMTRs?
The calculation of EMTRs and their use in policy debates assumes that people are motivated by money, that their choices are influenced by effective tax rates at the margin, and that their behaviour may change accordingly. But this is not the only motivation of individuals to earn income and in particular, to do paid work. We need to take account of other factors, such as long term benefits from work. Someone might work to gain experience or to maintain attachment to the labour force, notwithstanding any short-term financial disincentives.
There are also administrative ways we push people to work even in the possible absence of short-term financial rewards, for example the Newstart work test. Figure 9 shows very high EMTRs for a person on Newstart allowance but these extend over a limited range of income, so it is possible to jump right over the ‘hump’ on attaining a job. Newstart recipients may be faced with discrete job offers rather than choices to work more or fewer hours.
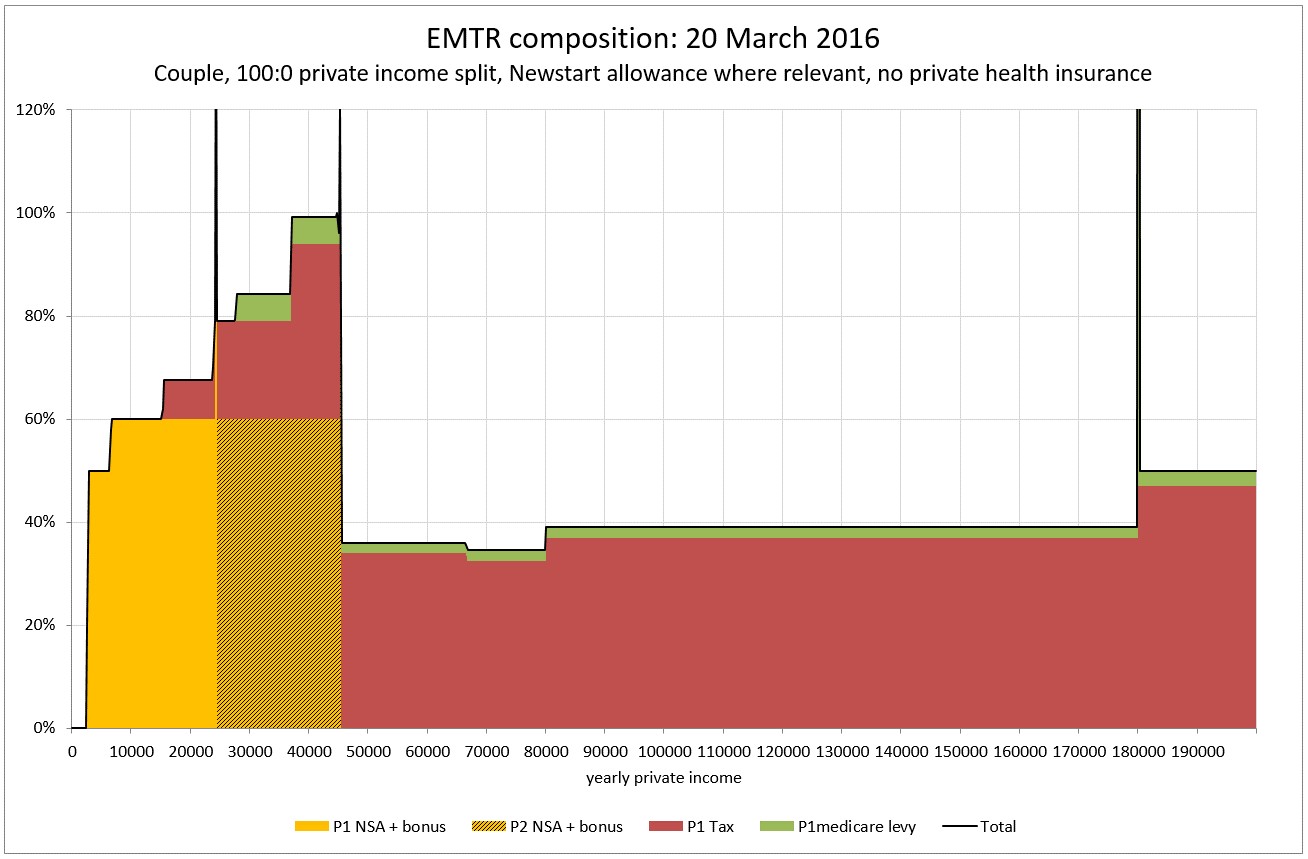
This may become more problematic for a couple, especially if the job offer is for part-time work, as they may need the income but be deterred by the high EMTR on a relatively low wage (up to $40,000 a year as shown in Figure 10).
Figure 1: single person, Newstart Allowance 
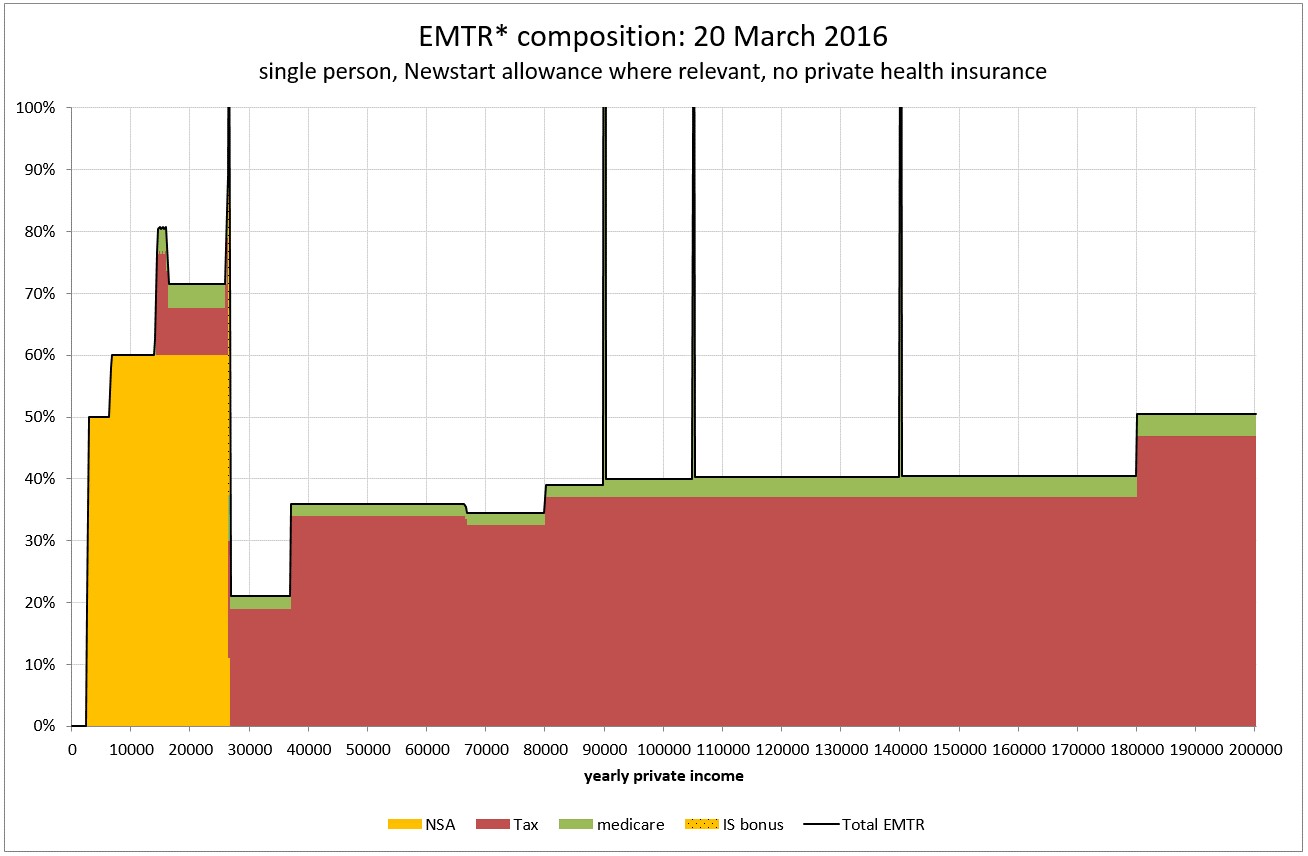
Figure 2: couple, Newstart Allowance
The elasticity of labour supply
Economists refer to elasticities of labour supply (or work choices) at the ‘intensive’ and ‘extensive’ margin.
The ‘extensive margin’ refers to ‘how many people work’, or the choice to work (or not).
The ‘intensive margin’ refers to ‘how much a given number of people work, on average’, for example, how many hours a person chooses to work. In the area of retirement decisions, there is evidence the extensive margin is much more important that the intensive one, as it affects the decision to stay at work or leave (and retire). There is also evidence that labour supply is elastic (responsive) around this margin. Once having left work, older workers may find it very difficult to get back into the labour force and so their labour supply may be more inelastic, but at the point of retirement they are likely to have much more choice.
Policy implications
It is often seen as desirable to reduce high EMTRs so as to reduce this barrier to increased earning or work participation. One way to reduce EMTRs is to reduce benefits, an option which some find attractive but most do not.
Other ways to reduce EMTRs include to reduce tapers or to reduce tax and benefit taper interactions. In means testing, there can be options to sequence tapers so that they do not overlap. However in reducing EMTRs there is a risk that by incentivising the target group we are disincentivising two other groups – 1. Those newly brought into the assisted group as a result of lower tapers, and 2. Those paying higher taxes to finance the higher benefit or reduced taper (which will usually have a net fiscal cost).
The ultimate desirability of a change depends on the economic distortions produced by the transfer system relative to the distortions induced by income taxation, not the fiscal cost itself. For example, we know that work effort of secondary earners in a couple (usually, women) is more elastically supplied than for primary earners (usually, men). See, for example, this European metastudy, and some results for Australia here. On this basis, reducing taxes on the former by raising them on the latter may well make economic sense.
The Henry Tax Review makes three recommendations that impact particularly on EMTRs. They are that: all welfare payments should be made non-taxable; a higher income tax threshold of $25,000 should be established, allied with a standard rate of 35 per cent; and the family-payment income test should become a standard taper of 15 or 20 per cent applying to an integrated family payment. Ingles 2009 suggested that
The tax-free status of the pension at first reduces the EMTR but later raises it, so the EMTR structure becomes less smooth. It is not clear that this is a net improvement [see the earlier discussion about DSP]. There is a net improvement for allowees…There would be a net improvement for families, which are not affected by tax exemption as family payments are already exempt. The single taper of 15 or 20 per cent replaces existing tapers of 20 and then 30 per cent so EMTRs are generally improved, particularly for secondary earners whose income puts the family into income zones where the base rate of FTB-A is lost… In general, the recommendations of the Henry Tax Review are a slight improvement on the current situation but they do not address really fundamental issues and lack a coherent underlying rationale. (pp14-15)
Newstart, sickness and Youth Allowance
An option (see Ingles 2009) is a flat 50 per cent taper for these allowances. A critical issue here is that the economy is not currently creating as many full time as part-time jobs (306,000 part-time compared to 150,600 ful-time in the past 3 years). This means that the idea that Newstart allowees can ‘jump over’ the high EMTR part of the graph – shown above – is becoming less tenable. If we wish to create a continuous incentive to earn extra income in Newstart recipients, some taper reduction might appear indicated.
Age pension
It is tempting to assume that high EMTRs are bad and should be leveled wherever possible. However this conclusion is too simplistic. For example it has been suggested that in relation to the age pension, the optimal taper is 100%. This is a modelling result which stems from the fact that a high taper first, reduces the number of pensioner affected by tapering (more are above the cut-out points) and second, reduces the marginal rates of income tax which are used to finance the pension. However this conclusion, while perhaps apposite if the only objective of the pension is a strict anti-poverty one, is less convincing if the ‘near-poor’ are a concern and if adequate earnings replacement rates are a policy goal.
Ingles and Stewart 2015 suggest rebalancing assistance for the aged away from the tax system (where superannuation tax concessions cost some $30 billion annually) and towards the pension system, by reducing EMTRs. Options to achieve this include lowering the taper (a 25 per cent taper would interact with income tax to produce EMTRs around 50 percent) or shielding pensioners from tax until their income reaches the means test cutout points – which also produces EMTRs of 50 per cent. Both these proposals extend the range of high EMTRs, but flatten them compared to those now current. These authors modelled retirement systems with a flat 35 per cent taper and showed that this produced a quite defensible structure of earnings replacement rates.
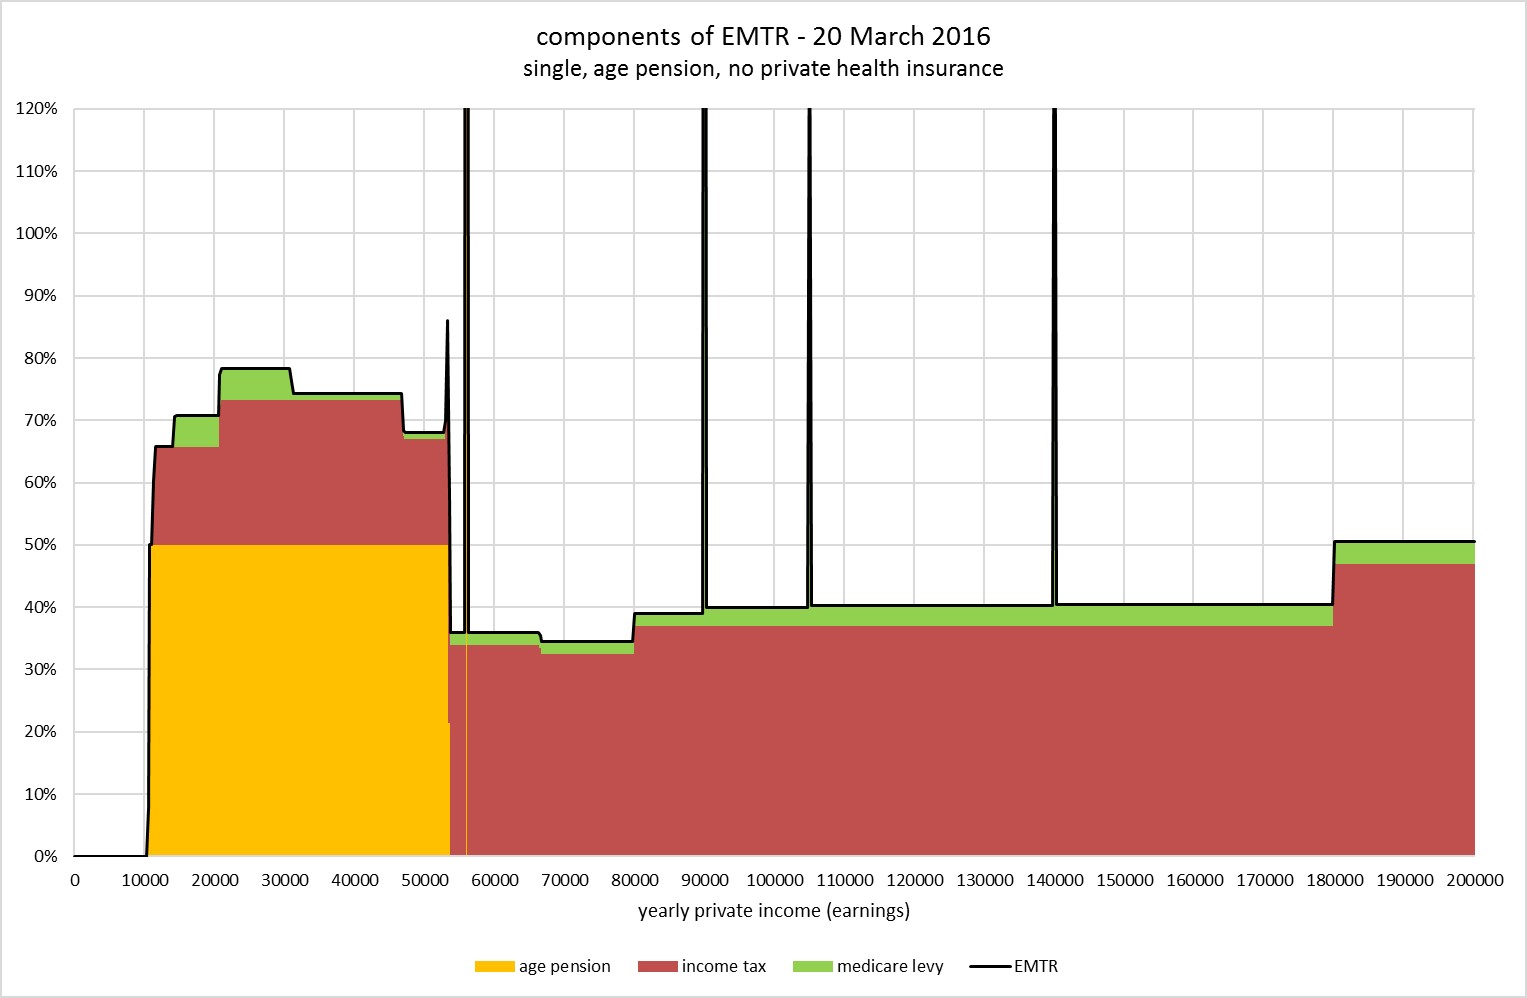
In Australia, there is a discount for earnings in the age pension means test, the Work Bonus, so the EMTR depends on the source of income. The first $250 of fortnightly employment income is not assessed and is not counted under the pension income test. The bonus operates in addition to the pension income test free area. Some researchers have modelled reforms which disregard earned income entirely, and find that they markedly increase labour force participation. The charts presented here assume that income is earned.
Figure 11: EMTR single Age Pensioner
Other EMTR focused options include abolishing the means test, or enhanced earnings disregard.
Incentives for women’s workforce participation
In its Game Changers Report, the Grattan Institute suggested that “removing disincentives for women to enter the paid labour force would increase the size of the Australian economy by $25 billion per year”. They note that the major influences on female workforce participation are marginal tax rates and the net costs of childcare, but don’t make any policy recommendations. This Report also looked at labour force participation among older workers. Options include increasing the pension and preservation ages, which illustrate that there are other policy approaches, in many cases, than those focusing only on EMTRs.
We have already noted that the Productivity Commission has recommended changes to childcare subsidy arrangements designed to reduce work disincentives. Other measures could focus on income support and tax arrangements. For example, Hayes and Redmond 2014, consistent with Apps and Rees 2010, call for a universal (taxable) family payment. Apps alternatively considers means testing family payments only on the primary earner’s income.
Figure 3: EMTRs for single person with 2 children age 8 and 10 (childcare not inc.) 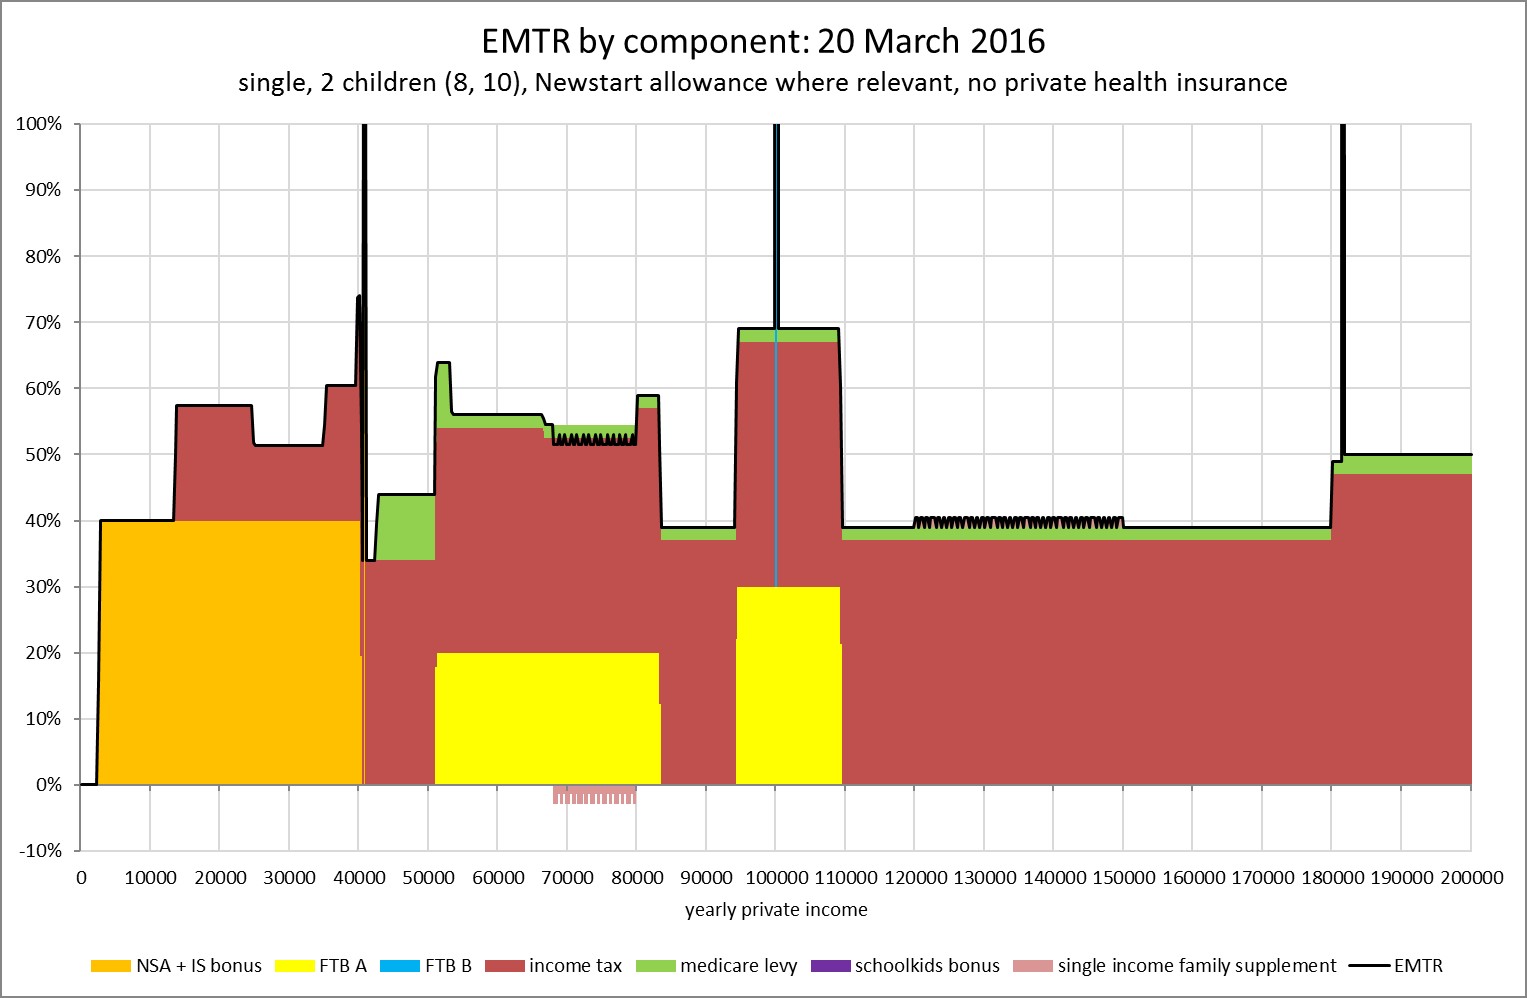
Figure 4: EMTRs couple with children, 8 and 10, no childcare
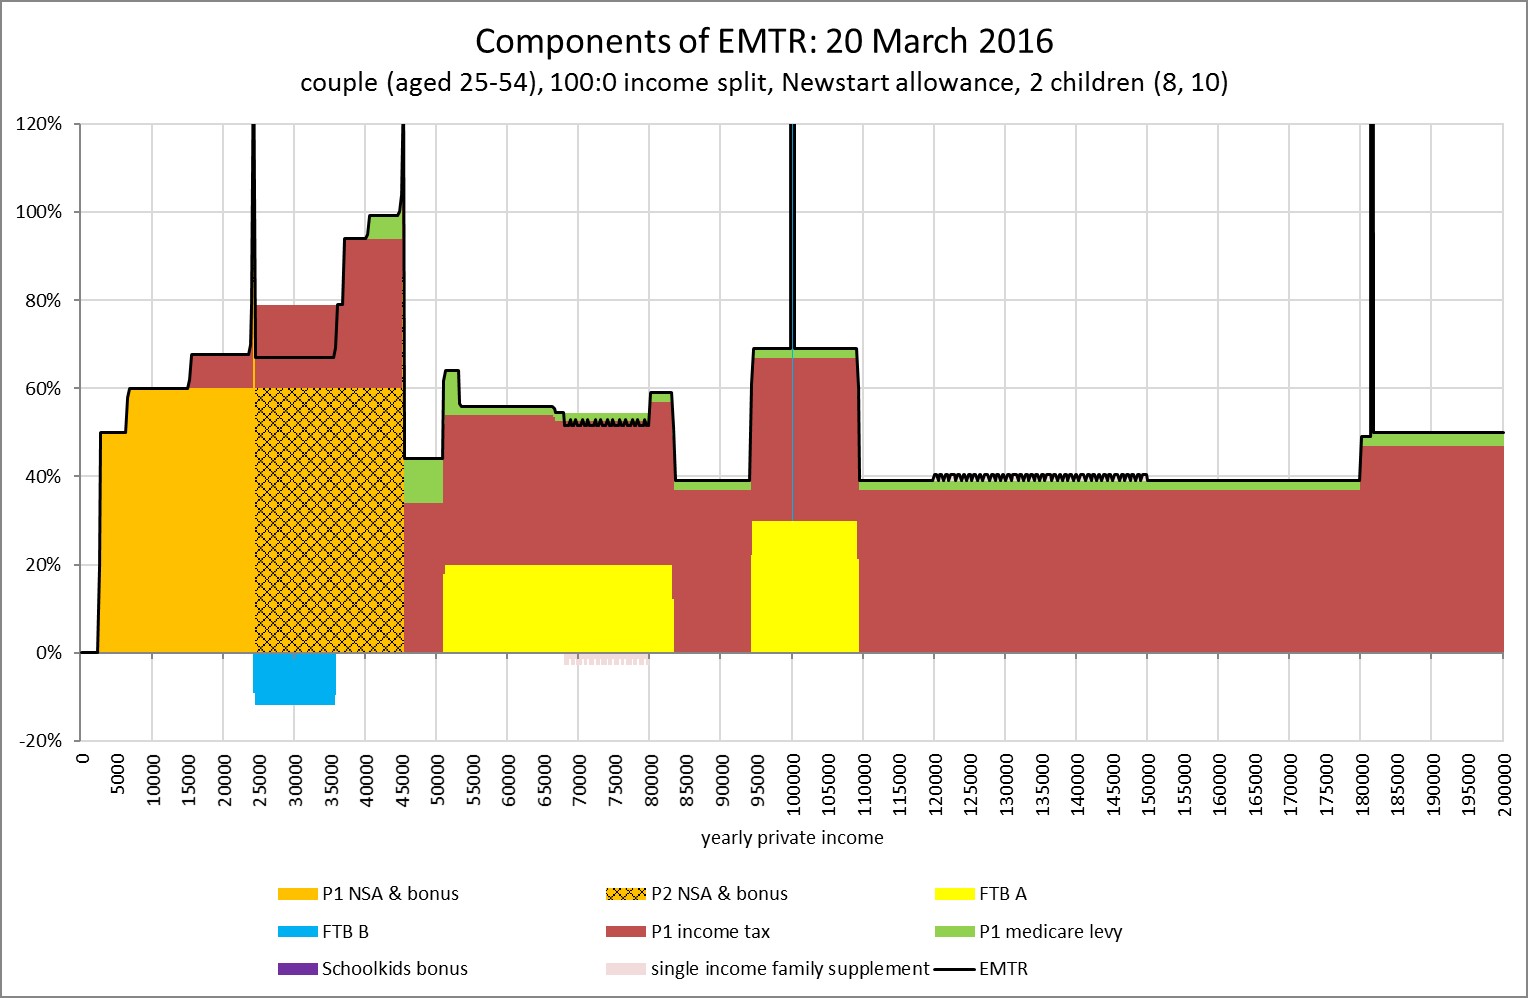
In such a household the withdrawals for partner 1 income support, partner 2 income support and FTB A are deliberately sequenced (in that order). Sequencing is one approach to avoiding income test stacking (and possible high EMTRs).
Despite the aforementioned sequencing, EMTRs are still high over the partner 2 withdrawal range because of a unit of assessment problem – the reductions in P2’s income support is ‘invisible’ to the tax system so P1’s income tax rates simply stack on top.
Ingles 2009 canvassed reducing the FTB-A taper to a flat 15 per cent and abolishing the two-tier taper (now 20 per cent initially and 30 per cent above $95,000). The Henry Tax Review suggested similar changes.
Disability and sickness
In the area of disability that Government has effectively tightened access by moving some moderately disabled people onto Newstart or Youth Allowance under ‘welfare to work’ reforms. This has raised EMTRs at low incomes but reduced them at middle incomes. To materially reduce work disincentives for this group would require something similar to New Zealand’s national compensation scheme, which pays non-means tested but taxable benefits related to prior earnings.
Various Australian governments have looked at this, but the constitutional and other impediments have always proved too difficult. By contrast earnings-related pay for sickness was early established in wage agreements and has proved enduring. Once time limits expire for sick pay, the sick or disabled person is thrown onto the benefit system and faces EMTRs similar to those shown for Newstart allowees. However if they are sick for an extended period they may move onto Disability Support Pension (DSP).
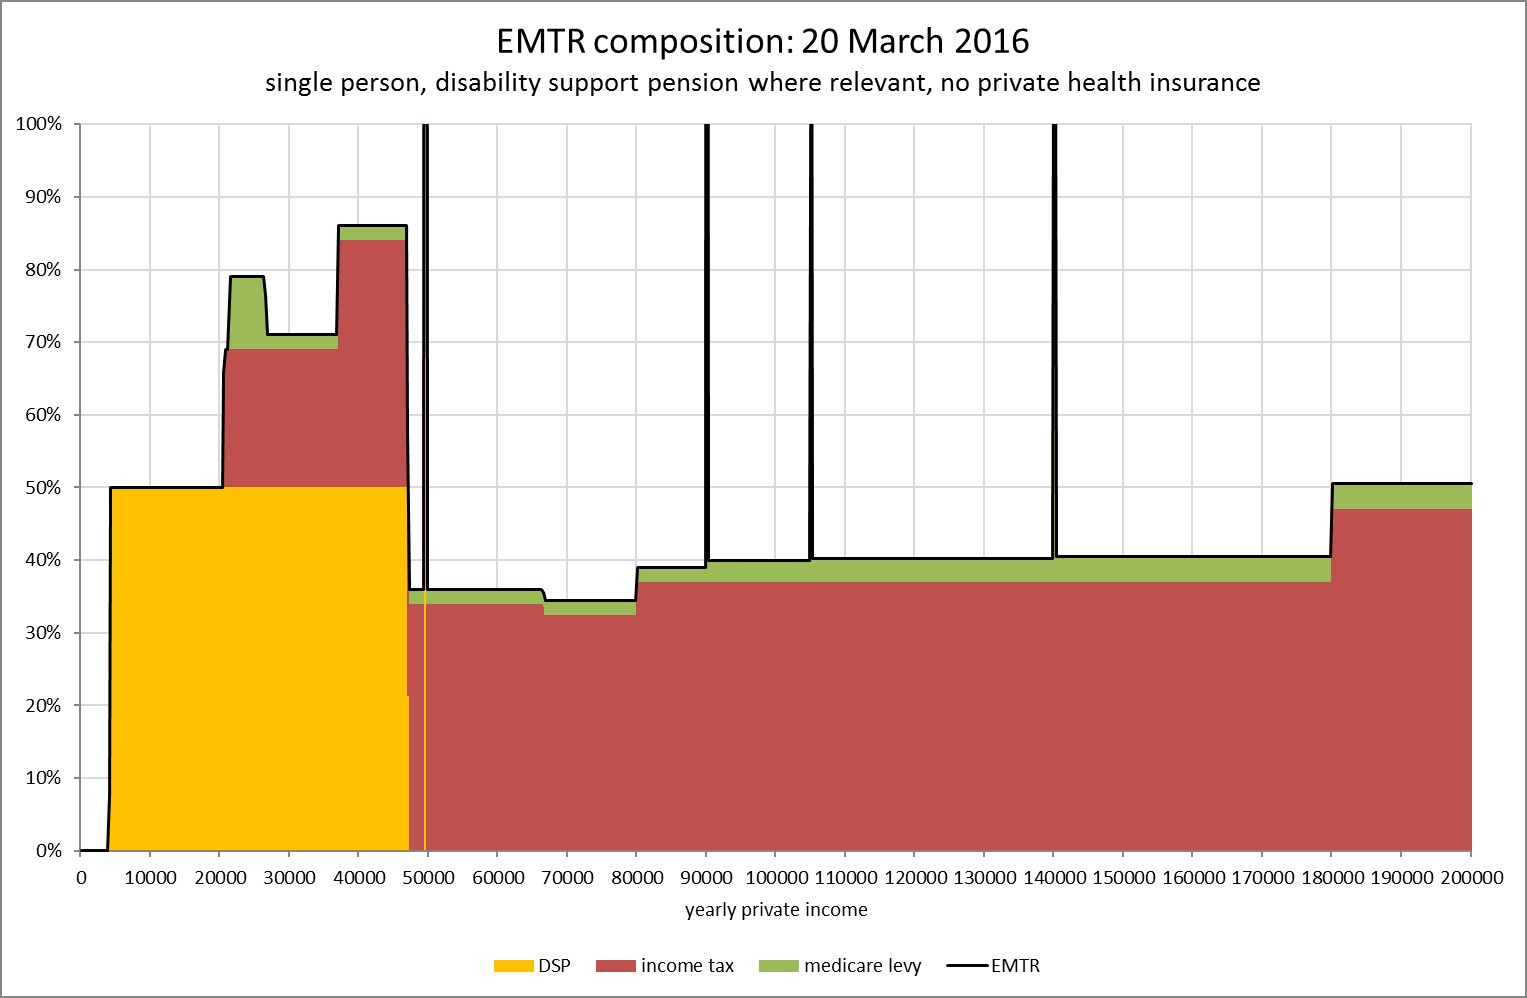
The EMTR charts for disability pensioners look similar to those for pensioners with small tweaks. DSP and Carer pension is not taxable, so the initial EMTR is 50 per cent exactly. However when tax does cut in it is additive to the taper, so EMTRs become higher than for the age pension. In the latter case the taxation of the pension has the paradoxical result of smoothing EMTRs as tax applies to the increase in net income after tapering.
An EMTR chart for single DSP is shown at figure 14. Note that this is an even more theoretical illustration than is usually the case for these charts. This is due to the apparent conflict between EMTRs associated with increasing hours of work and basic qualification issues for DSP, which depend on the applicant not being able to work more than 15 hours a week.
Figure 5: EMTR chart for single Disability Support Pension
Housing assistance
Commonwealth rent assistance is designed to phase out at a higher income than other payments, and so its means test does not ‘stack’. However, state housing rental rebates do phase out sooner and this can create very high EMTRs in the phase-out income range.
An option canvassed in the Henry Tax Review is to abolish the separate State Housing Rental Rebate (SHRR) schemes and replace them with a greatly expanded scheme of Commonwealth rental assistance. This might be quite expensive, but it would remove one of the current serious poverty traps (not illustrated here) and assist low-income renters in a major way.
Major reforms
Major reform proposals to address EMTR problems tend to involve the replacement of current arbitrary schedules of tax rates by income with simple linear tax structures, usually involving variants on a guaranteed minimum income or negative income tax , ideas that go back to the 1970s or earlier. This includes for example demogrant schemes including Basic Income, which is again in the spotlight with trials in several places such as Ontario and a recent referendum in Switzerland, which failed to pass but garnered 23 per cent support.
The problems with these broad proposals is that, if we are to provide basic support comparable to current pension rates, the implied linear tax rates can be very high indeed – over 50 per cent (Dawkins et al 1998). This can be partly addressed by paying higher rates for ‘categorical’ groups such as the aged and the disabled and lower rates for people who can normally be expected to be in the workforce. See, for example, the scheme outlined in the Henderson Poverty Inquiry Report 1975). However the tax rates suggested by Henderson (around 40 per cent) are no longer viable as they would now have to be considerably higher.
Ingles 2009 canvassed options for reducing the very high linear tax rates involved in demogrant or negative income schemes. These options mainly involve tax base broadening – eliminating some very large tax expenditures in the income tax, and expanding payroll tax and/or the Goods and Services Tax (GST). Low income compensation would be provided though the demogrant itself. While these measures could produce a viable scheme, they are so radical in the current political context as to be effectively unavailable.
This Policy Brief is based on graphs produced by David Plunkett, who maintains a spreadsheet model of the tax/transfer system. His blog is at http://ravebydave.blogspot.com.au/
Further reading
Apps, P (2015) ‘The Central Role of an Income Tax in a Modern Economy’ 30 Australian Tax Forum 845
Chetty R and Saez E (2009) ‘Teaching the Tax Code: Earnings responses to an experiment with EITC recipients,’ Non-Technical Summary of NBER Working Paper No. 14836 (March 4, 2015)
Colombino (2015) ‘Is unconditional basic income a viable alternative to other social welfare measures?’ IZA World of Work
Kalb G (2007) ‘Interaction of the Tax and Social Security Systems in Australia: The Effect on Effective Marginal Tax Rates’ The Australian Economic Review, vol. 40, no. 2, pp. 186–93
Productivity Commission (2014), ‘Early Childhood Education and Childcare’, Appendix E (Effective Marginal Tax Rates)
Productivity Commission (2015) ‘The Incidence of the Tax and Transfer System’, Chapter 5, Tax and Transfer Incentives
Whiteford, P (2013) ‘The Financial impact of welfare, tax and childcare arrangements’, CEDA Chapter 3, Women in leadership: Understanding the Gender Gap
OECD Tax/benefit studies and EMTR charts are all available here: http://www.oecd.org/els/benefits-and-wages-statistics.htm and here http://www.oecd.org/els/soc/benefits-and-wages-country-specific-information.htm


Recent Comments