

There is considerable literature on the determination of a country’s tax ratio, or tax level, as a percentage of GDP. Studies explore the potential tax ratio, tax effort and tax inefficiency of country tax systems, using annual panel data at the country level. In our recently published Australian Tax Forum article, we contribute to the literature by applying stochastic frontier analysis to examine the quantitative impact of various determinants of tax ratio and tax collection inefficiency.
Existing studies of tax ratio tend to be limited in three areas. First, in terms of their research approach to identify the potential tax ratio, tax effort and tax inefficiency, most existing studies employ the regression approach with varying techniques of estimation. Second, in terms of explanatory variables, little attention has been paid to those factors that are under the control of tax authorities such as tax rate or tax complexity. Third, in terms of countries studied, most empirical studies have focused on developing or transition countries in Asia and Africa.
The advantages of the stochastic frontier analysis approach that we used include (i) more intuitive and policy relevant estimates of tax potential and tax effort, and (ii) the ability to identify weak areas of tax administration and institutional environment. The stochastic frontier analysis can also provide an alternative way of estimating tax gaps.
We focus on 36 OECD member countries from 2005 to 2018. The scope of our study is confined to OECD member states for several reasons. First, it represents a set of developed countries with generally comparable tax systems, especially those belonging to the European Union. It is thus more legitimate to speak of a common tax ratio function or tax inefficiency function. Secondly, the OECD provides a wide range of consistent and reliable data of member countries. Thirdly, there are few empirical tax ratio studies focusing on developed countries.
The data employed are derived mainly from the OECD and the World Bank. We note that the OECD and World Bank do not generally provide consistent data. In particular, the OECD’s data for tax ratios are higher than those provided by the World Bank. For example, Australia’s tax ratio in 2017 was stated as 28.532 per cent by the OECD and 21.916 per cent by the World Bank.
The data discrepancies between the OECD and World Bank can be explained by the differences in their treatment of various taxes and the institutional structures of social security and government-mandated pension schemes. For data consistency, whenever data for a variable can be obtained from both OECD and World Bank sources, we chose to use the OECD source.
Applying a stochastic tax frontier model
Our stochastic tax frontier model involves two stages of estimation. In Stage 1, we estimate the effects of structural and institutional factors on the tax ratio, and then predict the inefficiency term. In Stage 2, we regress the predicted inefficiency term on a number of explanatory variables. As a robustness check, a variety of model specifications (with different sets of explanatory variables and different assumptions about the distribution of the non-negative random variables) have been estimated.
A novel feature of our study is that we explicitly incorporate proxies of tax policy and administration, namely, total tax rate and tax compliance burden, in estimating the tax ratio regression equation in Stage 1.
The tax compliance burden is proxied by the time to comply with tax requirements, developed by PwC for the World Bank’s Doing Business Report.
Modelling the potential tax ratio
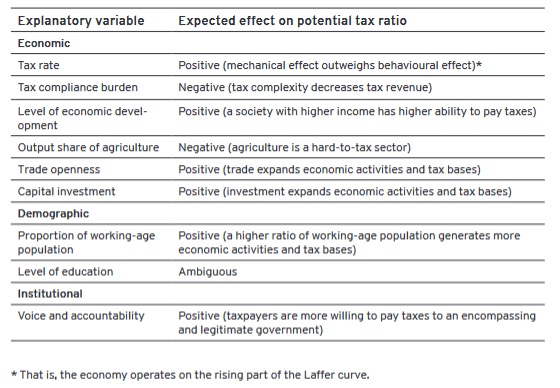
In Stage 1, we estimate the determinants of the tax ratio and predict the inefficiency term (see Table 1 for a list of explanatory variables). We find that all estimated coefficients are statistically significant (mostly at 1 per cent level) and have the expected signs.
Table 1: List of explanatory variables in the first-stage estimation
 (Source: Table 2, Tran-Nam and Le 2022)
Concerning the total tax rate and tax compliance burden of a country, our study confirms that:
- tax rate positively affects tax ratio significantly. For example, a 1 per cent increase (decrease) in the total tax rate directly raises (reduces) the tax ratio by almost 0.1 per cent; and
- tax compliance burden negatively influences tax ratio significantly. For example, a 1 per cent increase (decrease) in the tax compliance burden reduces (raises) the tax ratio by almost 0.07 per cent.
Structural (economic and demographic) variables also have a positive and significant impact on the tax ratio, including trade openness, capital investment and population share of the workforce. In contrast, the output share of agriculture (a hard-to-tax sector) has a negative and significant impact on the tax ratio.
Australia is a low tax collection and low tax effort country
We define low (high) tax collection countries as those with tax ratio below (above) OECD average (34.51 per cent) and low (high) tax effort countries as those with tax effort below (above) OECD average (88.45 per cent).
We classify OECD member countries into four groups as follows:
- low tax collection—low tax effort: Turkey, Ireland, Switzerland, Australia, Japan, Lithuania and Spain;
- low tax collection—high tax effort: Mexico, Chile, South Korea, the US, Latvia, Slovak Republic, Israel, Canada, New Zealand, Estonia, the UK, Portugal, Poland, Czech Republic;
- high tax collection—low tax effort: Greece, Luxembourg and Finland; and
- high tax collection—high tax effort: Germany, Netherlands, Slovenia, Iceland, Hungary, Norway, Austria, Italy, Sweden, Belgium, France and Denmark.
Australia is a low tax collection and low tax effort country. Australia’s relatively low tax effort (or, equivalently, relatively high tax inefficiency) is primarily caused by the narrowness of its tax bases relative to its potential tax bases. For both income tax and the Goods and Services Tax, Australia’s actual tax base over the potential tax base is relatively smaller than those of many other OECD countries.
Explaining tax ratio and tax effort
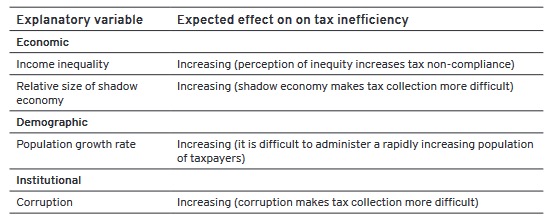
In Stage 2, we examine tax effort by regressing the predicted tax inefficiency term on a number of explanatory variables (see Table 2). Our analysis yields meaningful and significant results that shed light on the revenue performance of the OECD member countries.
Table 2: List of explanatory variables in the second-stage estimation
 (Source: Table 3, Tran-Nam and Le 2022)
The various results using different model specifications or estimation techniques that are qualitatively comparable, thus suggesting that our approach is robust. We use a variety of different specifications as a robustness check. We adopt the Driscoll–Kraay standard errors estimation method, which is appropriate because of its ability to handle an unbalanced panel dataset and other common panel data problems such as serial correlation, cross-sectional dependence and heteroscedasticity.
Importantly, all estimated coefficients (shown in Table 9 of our journal article) exhibit correct signs. Income inequality, population growth rate and size of the shadow economy tend to increase tax inefficiency, while control of corruption reduces tax inefficiency, as predicted by theoretical analysis.
An interesting finding is that while income inequality and control of corruption affect tax inefficiency in opposite directions, each of income inequality and control of corruption moderate the impact of the shadow economy on tax inefficiency. That is, the signs of the estimated coefficients of the two interactive terms between shadow economy and control of corruption, and between shadow economy and income inequality have negative and significant coefficients. This suggests plausibly that the effect of the shadow economy on tax inefficiency is moderated to some extent by the interaction between the shadow economy and the control of corruption. Similarly, the effect of the shadow economy on tax inefficiency is also moderated by the interaction between the shadow economy and the degree of income inequality.
Implications for improving tax effort
Overall, our empirical results appear to be plausible. Our findings of Stage 1 confirm the positive impact of the tax rate on the tax ratio and provide some evidence of the adverse impact of tax complexity on the tax ratio.
There are some data limitation problems with our study, due to relying on readily available secondary data to proxy theoretical variables. For example, we draw on the World Bank/PwC measures of total tax rate and tax compliance burden (time to comply and payments). These are not conceptually satisfactory, but they are the only proxies that are currently available for panel data tax studies.
Our results also confirm the ‘sanding-the-wheel’ hypothesis, namely higher voice and accountability increase tax revenue collection whereas better control of corruption reduces tax inefficiency.
This suggests that without increasing the tax rate or the tax base by legislation, governments can improve their tax levels through tax policy or administrative simplification, more effective control of tax corruption, or higher level of voice and accountability.


Recent Comments