
The latest ANUpoll shows that people would prefer the government to tax their way out of deficit rather than to reduce spending on social services. In particular, the areas they don’t want cut are health, education and welfare spending.
54 per cent prefer higher taxes compared to only 32 per cent who prefer lower spending. This follows a long term trend in the poll towards people favouring more spending over less taxation. In 1987 65 per cent preferred less taxation and just 25 per cent preferred spending more on social services. By 2016 only 36 per cent favour reducing taxes and 55 per cent favour more social spending.

Source: ANUpoll on Tax and Equity, March 2016
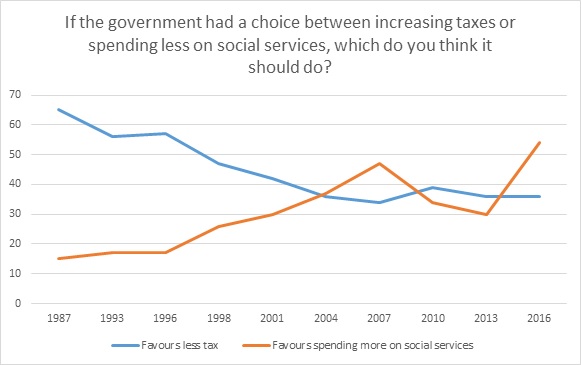
Source: Australian Election Study, 1987 to 2013; ANUpoll on Tax and Equity, March 2016
In spite of the preference for tax hikes over spending restraint, those polled preferred reduced spending in ‘non-welfare’ areas when asked about the best way to reduce government debt. When separately asked about these non-welfare areas, such as health, education, aged care and the environment the vast majority still preferred more spending to less.
Is Australia’s tax system fair?
When asked about the overall fairness of the tax system, 60 per cent think that the system is moderately or very fair. Only 4 per cent agreed the tax system was ‘very fair’. It is concerning that 40 per cent of those polled think that the system is “not too fair” or “not fair at all”.
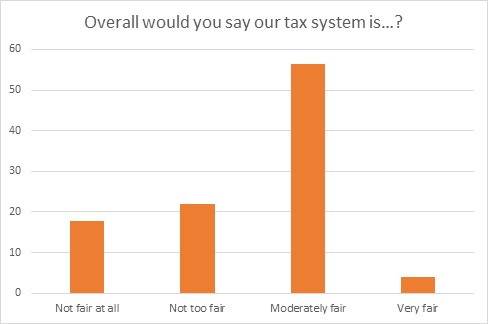
Source: ANUpoll on Tax and Equity, March 2016
Australians confused about progressivity of the tax and welfare system
These general perceptions of fairness or unfairness may reflect some confusion among those polled, about who pays Australian taxes and who benefits from spending in the social welfare budget. Australians think that low-income people are taxed too much and high-income people are taxed too little. They also think that older people are taxed too much. There is a general consensus that companies, particularly international companies are taxed too little.
Thanks to a progressive tax system and tax breaks for older Australians the reality is that low income Australians and older people pay very little tax while the vast majority of tax is paid by high income Australians. In fact, around 13 per cent of the taxes covered by the ABS Household Expenditure Survey are paid by the bottom 40 per cent of the income distribution and 71 per cent is paid by the top 40 per cent. The top 20 per cent pay around 10 times the amount of tax that the bottom 20 per cent pay.
Tax/Benefit^: distribution by household income quintile ($pw)
| Tax | Q1 (Low 20%) | Q2 | Q3 | Q4 | Q5 (Top 20%) | All |
| <65 | $126 | $224 | $367 | $559 | $1,074 | $470 |
| 65+ | $82 | $117 | $194 | $289 | $689 | $274 |
| All | $108 | $187 | $343 | $538 | $1,049 | $445 |
| All% | 4.8% | 8.4% | 15.4% | 24.2% | 47.2% | 100.0% |
| Benefits | ||||||
| <65 | $704 | $714 | $519 | $345 | $248 | $506 |
| 65+ | $771 | $928 | $647 | $553 | $364 | $653 |
| All | $732 | $789 | $536 | $361 | $255 | $535 |
| All% | 27.4% | 29.5% | 20.1% | 13.5% | 9.5% | 100.0% |
^Benefits include cash and non-cash (in-kind) government benefits. Taxes include indirect taxes such GST and taxes on production.
Source: ABS, Household Expenditure Survey 2009-10
The table above shows the progressive nature of Australia’s tax and benefit system with the vast majority of tax paid by the highest income earners and most of the benefits going to low and middle income households. This is how the Australian system is supposed to operate and without such a system income inequality would be significantly worse.
The concept of the ‘deserving’ and ‘undeserving’ poor is one that influences the debate around welfare payments in Australia. The ‘deserving’ poor concept is often applied to those on the Aged pension while the undeserving poor relates to those receiving working age payments such the Newstart payment (unemployed), or the disability support or single mothers pensions. With much debate centred on the undeserving categorythis may explain why most people believe that the unemployment payment is Australia’s largest welfare payment. 45 per cent of those polled believed the unemployment payment to be the largest while only 24 per cent correctly identified the aged pension as the largest part of the welfare budget.
The unemployment payment costs the budget around $11.5 billion per year for around 750,000 recipients compared to $44.2 billion for 2.5 million aged pensioners. The unemployment payment ‘Newstart Allowance’ is currently set at $532.20 per fortnight compared to the aged pension at $873.90 per fortnight for singles.
It is concerning that Australians think that the unemployment payment not only contributes the most to the welfare budget but also, more so than any other area of government expenditure, they think the budget should spend less on this payment. Previous research of mine using a ‘half-median poverty measure’ shows that 65 per cent of persons with the Newstart payment as their main source of income are in poverty and 47 per cent remain in poverty for at least two years – around double that of aged pensioners.
While Australians are divided on whether or not government debt is Australia’s top economic priority there is little doubt that economic debate around the debt and the reform of taxation and government expenditure will remain. A major stumbling block to sensible debate and reform in Australia is that much of the current conversation is dogged by mythology rather than a debate informed by evidence.
About the ANUpoll
ANUpoll is a quarterly survey of Australian public opinion on an issue of national importance. The ANUpoll differs from other opinion polls by placing public opinion in a broad policy context, and by benchmarking Australia against international opinion.
The full report can be downloaded here.


Recent Comments