

The Australian welfare state is strongly “targeted” – though relatively small in size, it is relatively redistributive in effect. Or so we have usually thought. But in the last decade this self-image has been attacked from the Left and the Right. The Australian welfare state, we are now often told, has succumbed to middle-aged spread. Redistribution has come to favour those in the middle-income groups, couple families with dependent children especially. But how true is this claim? In a recent paper in the Australian Economic Review (“Middle-class Welfare and Vertical Redistribution in Australia: A Fiscal Incidence Analysis“) my co-authors John Phillimore and Alan Fenna and I argue that over the past few decades vertical redistribution has been strengthened.
Critics of middle-class welfare arrive at their position mainly through the analysis of spending, citing as examples the private health insurance rebate, the baby bonus, family payments and generous superannuation tax concessions. Methodologically, we differ from the critics in that we count all direct and indirect household taxes and all social expenditure, including expenditure in kind on health and education, as per the ABS fiscal incidence studies (Catalogue No 6537.0), which have appeared six times at five-yearly intervals since 1984.
The figure that matters, we think, is what the ABS calls “net benefits”, the sum of these household taxes and benefits. To show that middle-class welfare has increased or decreased involves showing that net benefits to the middle have increased or decreased. We think this stands to reason. An increase in gross benefits for the middle might accompany a decrease in net benefits, if taxes increase faster than expenditure. From a household’s perspective, what matters is not expenditure or taxation taken in isolation but the combined effect of the two. This simple point is critical to the argument, and we have been surprised how some seem to find it hard to grasp.
What do the fiscal incidence studies show? We divide the evidence into two categories: that for all households and that for couple families with children (but not sole parent families). The reason for the second category is that the critics of middle-class welfare have often taken two-parent families with dependent children to be its prime beneficiaries. There is also a problem in defining what counts as “middle”. The concept is elastic and has to be stipulated. We used two conceptions: one we called “around the median”, stipulated as the second, third and fourth quintiles; the other we called “the median and above”, meaning the third and fourth quintiles. The question as we frame it is this: have net benefits grown for either of these two versions of “middleness”, in the sample of all households or in the sample of families with children? The excellent ABS resources allow a categorical answer to this complex question. The answer is, quite simply, no.
All Households
Figure 1 shows the distribution of net benefits over time, expressed in 2010 dollars. Transfers from the highest gross income quintile to the other four quintiles have increased by about 35 per cent. The three lower quintiles have benefited. For the second and third quintiles, the increase has been fairly steady, while for the lowest quintile this increase has taken place only recently. Plainly, there is no blowout in “middle-class welfare”. Overall social welfare transfers to the bottom three quintiles are up by 177 per cent since 1984 and this increase has been made possible by increased rates of contribution from the well-off.
Nor is there any correlation between the general trend and the colour of the government. Critics focus on the period of Coalition government, 1996 to 2007. But if there was a point at which around-the-median welfare made significant gains it was in the period between 1988–89 and 1993–94, under Hawke–Keating Labor governments.
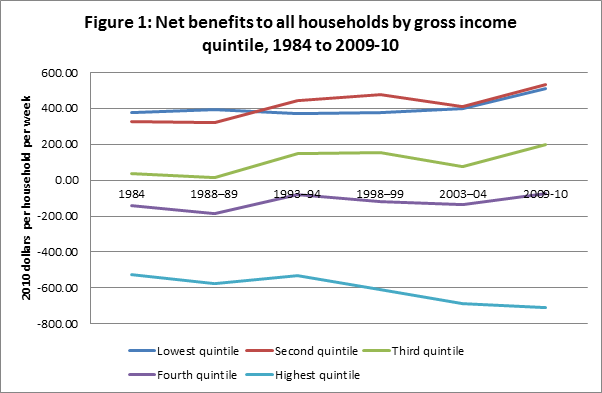
Source: ABS Cat No 6537.0 and calculations therefrom.
Couples with Children
Because couple families with dependent children are sometimes seen as the main beneficiaries of middle-class welfare, we applied the same analysis to them, with results as in Figure 2. Net transfers from top quintile households doubled across this period. Families in the bottom quintile made the biggest gains, up by 75 per cent. The middle quintile made only a small gain, between 1988–89 and 1993–94 under Labor. Since 1993-94 trends in the three middle quintiles have been quite flat.
Source: ABS Cat No 6537.0 and calculations therefrom. Data for 2003–2004 and 2009–2010 were supplied to the authors by the ABS.
Gross or net benefits?
Why then has the theme of rising middle-class welfare seemed persuasive? The main reason seems to be that those advancing this view have been focused on social expenditures to couples with dependent children, which they see as a middle class category. And it is true that, as Table 1 shows, support in cash and kind to couple families grew in this period, up by 80 per cent. However, taxation also grew at roughly the same rate. Overall, there was hardly any net gain to families. Even more striking is the fact that since 1984 net benefits for couple families taken as a whole has remained close to zero. Australia is not generous to this section of the population.
|
TABLE 1: Trends in Overall Spending and Taxing for Couple Families, 1984 to 2009-10 (2010 dollars per household per week)
|
Source: ABS Cat No 6537.0 and calculations therefrom.
Table 2 shows the comparable figures for all households, showing a rising trend in both benefits and taxes, with total benefits growing faster than total taxes.
|
TABLE 2: Trends in Overall Spending and Taxing for All Households, 1984 to 2009-10
(2010 dollars per household per week)
|
Source: ABS Cat No 6537.0 and calculations therefrom.
Conclusion
Fiscal incidence analysis is subject to some limitations: it does not count tax expenditures; it does not include the value of assets; it does not count public debt; and it tracks categories of household, not actual households. Our results are subject to these limitations.
Accepting these limitations, our analysis shows that since the 1980s the Australian welfare state has grown in both size and redistributive impact. Most of the growth in vertical redistribution has resulted from increasing contributions by the highest income quintile. The two lowest income quintiles have gained substantially. Except for a small rise in the period 1988-89 to 1993-94, there was no overall vertical redistributive trend favouring “middle class” households in the all households or in the couple families categories. There is no evidence of a blow-out in middle-class welfare in the period from the mid-1990s to 2010.
Contra those who have forecast its demise under the reign of “neo-liberalism”, the Australian welfare system is today bigger than ever, and this perhaps implies some increase in churn between benefits and taxes. The critics of middle-class welfare are motivated sometimes by equity concerns and sometimes by efficiency concerns. But some criticism is really directed at churning, where what the government takes away with one hand it gives back with the other to no net effect. However, this is a criticism on efficiency grounds, and it is conceptually quite distinct from the equity or distributional issue that is the focus of our analysis.
This article is based on Alan Tapper, Alan Fenna, John Phillimore, 2015, ‘Middle-class Welfare and Vertical Redistribution in Australia: a fiscal incidence analysis’, Australian Economic Review, 48(3), 1-15. DOI: 10.1111/1467-8462.12118


Interesting. I have been relying on OECD analysis that seems to contradict this. I will have to have a read.