

Perhaps the most peculiar thing about the 2016-17 Budget was the assumption about economic growth. Many commentators seemed to think that the growth figures were quite high (see, for example, ABS News) and this blog) but it was hard to see the implications of the underlying assumptions.
I did a few simple calculations to understand the growth figures a bit better. At first, I looked at the relationship between real GDP and government revenues because economic conditions have an immediate impact on revenues.
The figure below shows this relationship for the period 2000-2015. Both GDP and revenues have increased steadily over this period. Interestingly, this relationship is almost perfectly linear. In fact, GDP explains about 98% of the variation in revenues over this period.
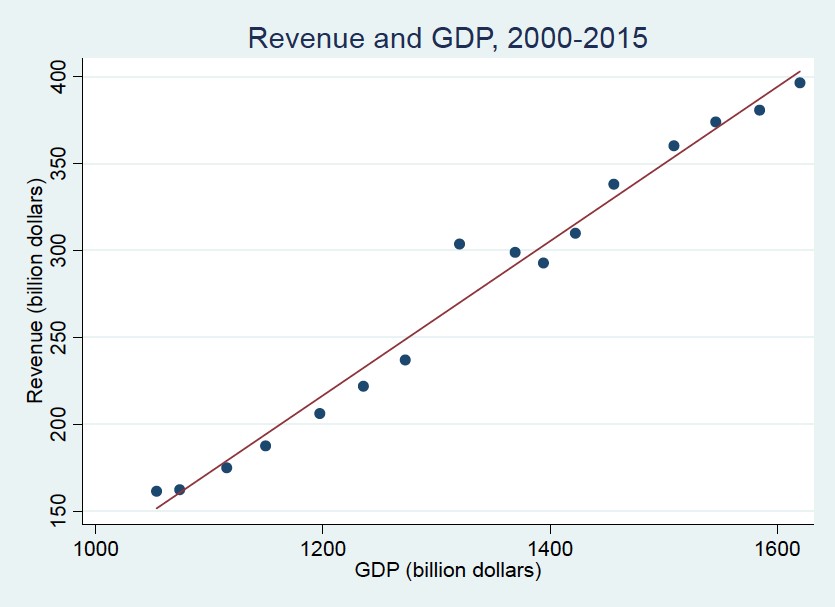
The strong relationship between GDP and revenues allows me to calculate predicted revenues at given GDP levels and I can even predict future revenues if I am willing to make assumptions about future GDP growth. However, before I try to predict the future, I want to see if my approach allows me to predict the past.
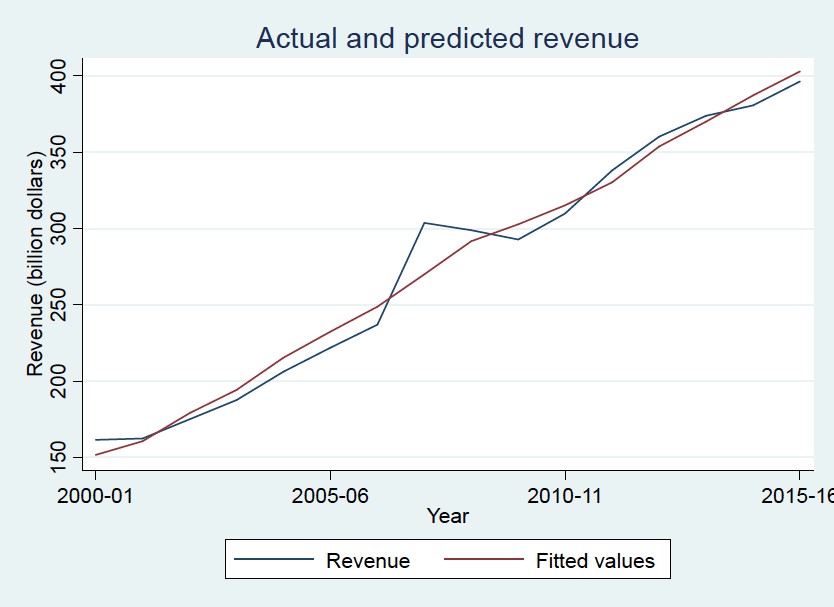
My second figure shows the actual and predicted values over the time period 2000-2015. The lines are quite close, suggesting that my ability to predict revenues at given GDP levels is not too bad.
Predicting future revenues requires assumptions about GDP growth rates. The first prediction that I want to test is based on the assumptions made in the Budget 2016-17: Real GDP growth of 2.5% in 2016-17 and 3% in each year from 2017-18 to 2019-20 (see Table 1 Budget Paper 1 Statement 2). I call this prediction “Scenario 1”.
Additionally, I want to see what happens to revenues when I assume lower growth rates. Instead of assuming 3% annual growth for the period 2017-18 to 2019-20, I want to consider three alternative scenarios that are less optimistic: These are annual growth rates of 2.5% (“Scenario 2”), 2.0% (“Scenario 3”) and 1.5% (“Scenario 4”) over the period 2017-18 to 2019-20.
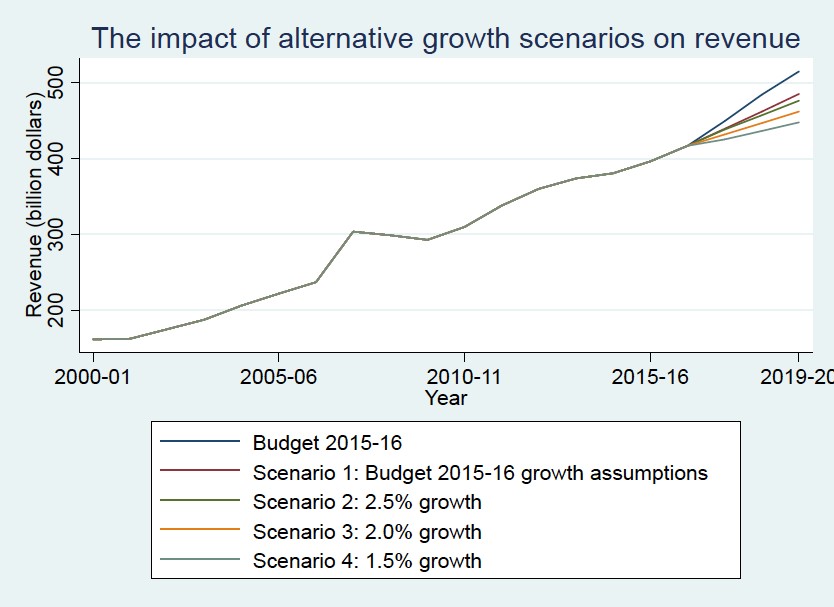
The figure below shows predicted revenues based on the four scenarios. I have also included the revenue predictions made in the Budget.
The first thing that is interesting about this figure is that my revenue predictions are quite different from those of the Budget, even if I make the same assumptions about GDP growth (Scenario 1, the red line).
The difference between my prediction and the Budget suggests that Treasurer Scott Morrison has not only been optimistic about future economic growth but also about how economic growth will be translated into higher revenues.
Interestingly, when I compare the growth in revenues over the past 15 years to the red line that I have estimated, my prediction looks like the continuation of a trend that I would expect if the economy would continue to grow as much as it has done in the past. Unfortunately, the revenues that I have projected under this scenario are much lower than the revenues presented in the Budget.
Things appear even more gloomy when I assume lower growth rates. Scenario 2, which is based on an annual growth rate of 2.5%, is not very different from my original prediction but the predicted revenues of Scenarios 3 and 4 are considerably lower than those of Scenario 1.
The differences presented above have enormous implications for the sustainability of government finances. Given the expenditure levels proposed in the Budget 2016-17, unrealistic assumptions and lower growth rates are likely to result in sizeable budget deficits in the coming years.
The table below summarizes the impact of different growth scenarios on the fiscal balance, assuming that expenditure levels will remain unchanged. The numbers illustrate that the fiscal deficit is likely to remain substantial over the coming years if the government does not address the revenue problem.

The analysis performed in this article is based on a very limited data set that can be extended in various directions. You can download the data here to study the growth puzzle in greater detail. The Stata code that was written to perform the analysis is available here as a text file.


Recent Comments